

Question: Question 3 The team knows that normal effects plots can be misleading when a large number of the terms are active. Hence, instead of a
Question 3 The team knows that normal effects plots can be misleading when a large number of the terms are active. Hence, instead of a normal effects plot, the team analyzes the data by pooling the three factor and higher interactions as error. Conduct an ANOVA on the remaining terms and fit the linear model. How many terms are in the model obeying simple hierarchy and not counting the constant? Answer as an integer. Question 4 Assuming the team was correct as to which two factor interactions were likely to be active, what is the maximum value predicted by the model in Question 1? Answer to two decimal places accuracy. Question 5 For this design and assuming no factors are entirely dismissible, what is the probability that this design would happen to include the factor level combinations which maximize the response? Answer as a probability expressed as a decimal to two decimal places accuracy. Question 6 Assuming the team was wrong about one of the interactions, and the interaction which they labeled as EF was actually the two factor interaction confounded with that effect, what is the maximum value predicted by the new model? Answer to two decimal places accuracy.
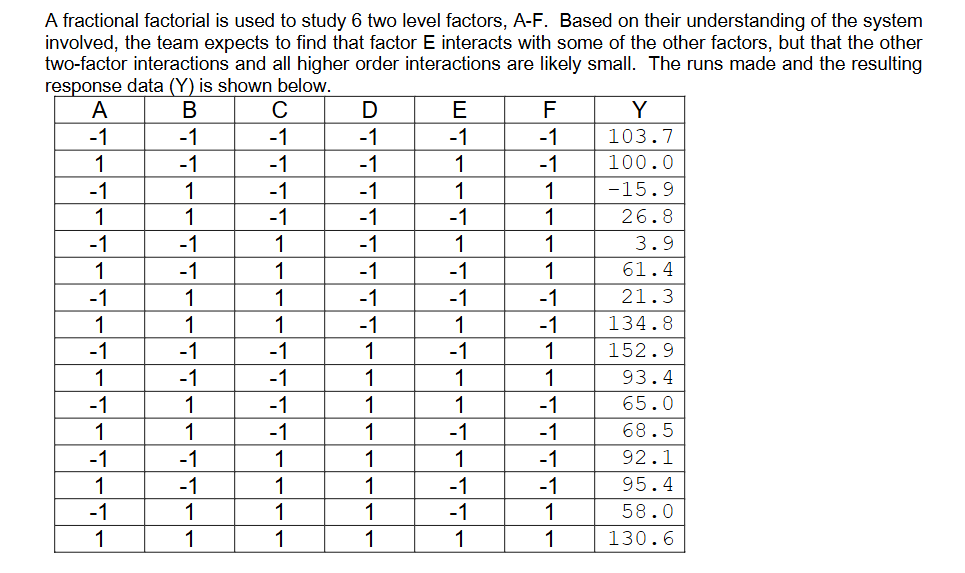 A fractional factorial is used to study 6 two level factors, A-F. Based on their understanding of the system involved, the team expects to find that factor E interacts with some of the other factors, but that the other two-factor interactions and all higher order interactions are likely small. The runs made and the resulting response data () is shown below. A Y -1 103.7 1 100.0 ) ~15.9 1 26.8 -1 3.9 1 61.4 ) 21.3 1 134.8 -1 152.9 1 93.4 R 65.0 1 65.5 X 92.1 1 95.4 -1 55.0 1 130.6
Step by Step Solution
There are 3 Steps involved in it

Get step-by-step solutions from verified subject matter experts