

Question: Question 3 (this question has three parts, a) b) and c) (20 marks) Part a. The table below lists P/E Ratios for some ASX-listed retailers
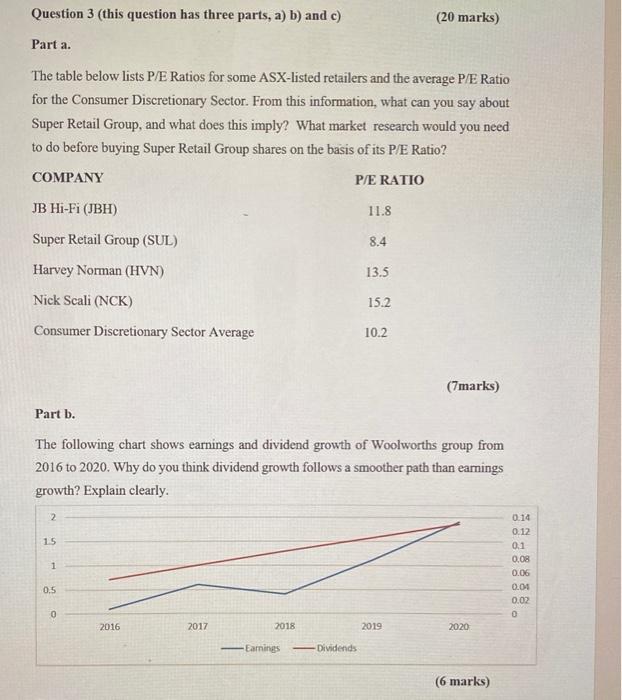
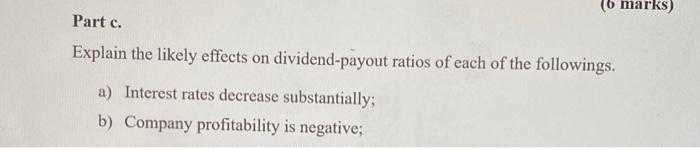
Question 3 (this question has three parts, a) b) and c) (20 marks) Part a. The table below lists P/E Ratios for some ASX-listed retailers and the average P/E Ratio for the Consumer Discretionary Sector. From this information, what can you say about Super Retail Group, and what does this imply? What market research would you need to do before buying Super Retail Group shares on the basis of its P/E Ratio? COMPANY P/E RATIO JB Hi-Fi (JBH) 11.8 Super Retail Group (SUL) 8.4 Harvey Norman (HVN) 13.5 Nick Scali (NCK) 15.2 Consumer Discretionary Sector Average 10.2 (Tmarks) Part b. The following chart shows earnings and dividend growth of Woolworths group from 2016 to 2020. Why do you think dividend growth follows a smoother path than earnings growth? Explain clearly. 2 15 1 0.14 0.12 0.1 0.08 0.06 0.04 0.02 0 0.5 0 2016 2017 2018 2019 2020 Earnings Dividends (6 marks) (b marks) Part c. Explain the likely effects on dividend-payout ratios of each of the followings. a) Interest rates decrease substantially; b) Company profitability is negative; c) Prospectus requirements are tightened, increasing the cost of share issues; d) Personal income (but not capital gains) tax increases; (7 marks)
Step by Step Solution
There are 3 Steps involved in it

Get step-by-step solutions from verified subject matter experts