

Question: Question 3: This question refers to the production function below the Parameter table - in the form Yn = A(qLc qKd ). Rearrange this function,
Question 3: This question refers to the production function below the Parameter table - in the form Yn = A(qLc qKd ). Rearrange this function, using the relevant numbers (A, c, d) from the Parameter table, to get an isoquant curve equation (i.e. qK = . . . ).
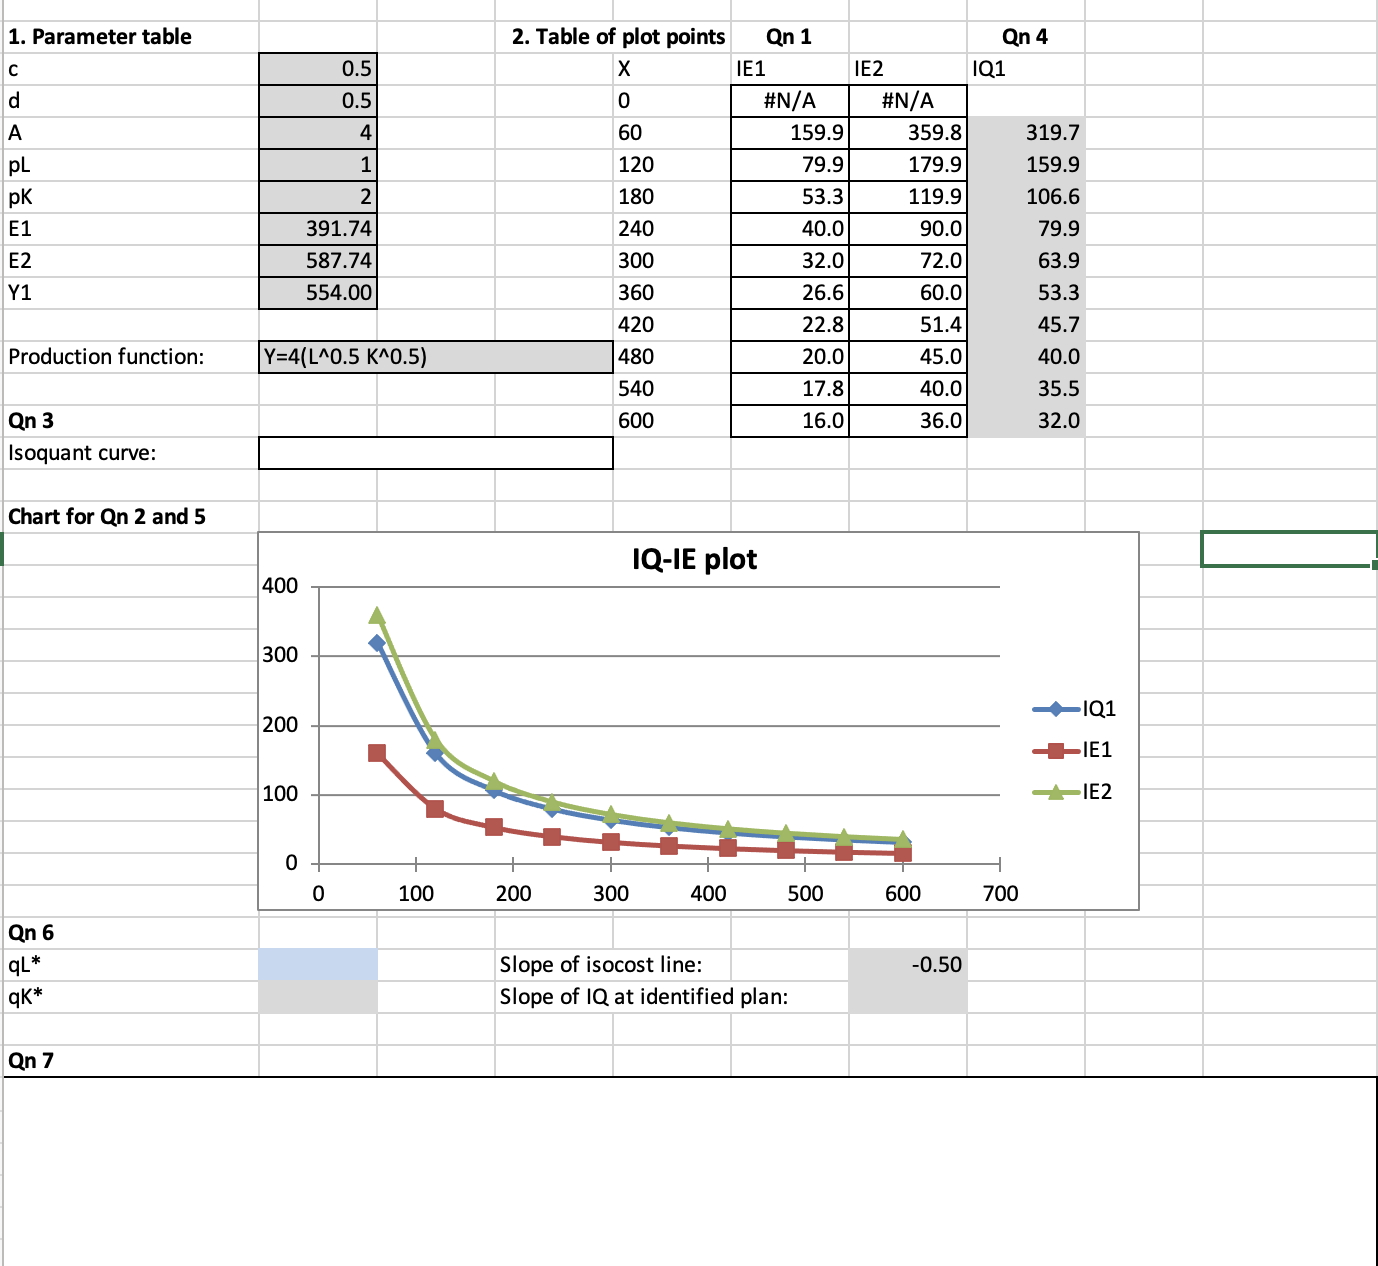
Question 4: This question will involve using the equation for the isoquant curve and a given level of output to calculate a set of plot points. Using the given level of output indicated (Y1), calculate a set of points (in the Table of plot points) for the range of qL shown in the table. Note, the formula for the first point where qL > 0 for the isoquant curve has been entered in the table.
Question 5: Plot the isoquant curve using the plot points calculated in the question above (as a scatter chart with a smooth line). (I.e. update/add the IQ data series in your chart.)
Question 6: Based on your table and chart, state the cost-minimising production plan, qL? , qK? (i.e. a pair of qL,qK values). Note: the equation for the isoquant can be used to calculate qK? as a function of qL? . In the spreadsheet, if you enter a value for qL in cell B56, the corresponding value for qK will be calculated automatically in cell B57.
Question 7: Explain why the production plan you have identified above is cost-minimising. State the firm's level of expenditure/cost to produce the given level of output indicated (Y1). (Hint: refer to slide 34, week 4 notes.)
Step by Step Solution
There are 3 Steps involved in it

Get step-by-step solutions from verified subject matter experts