

Question: Question 3 Three rainfall stations recorded rainfall ( in mm ) from June to December, as shown below. During this time, the rain gauge at
Question
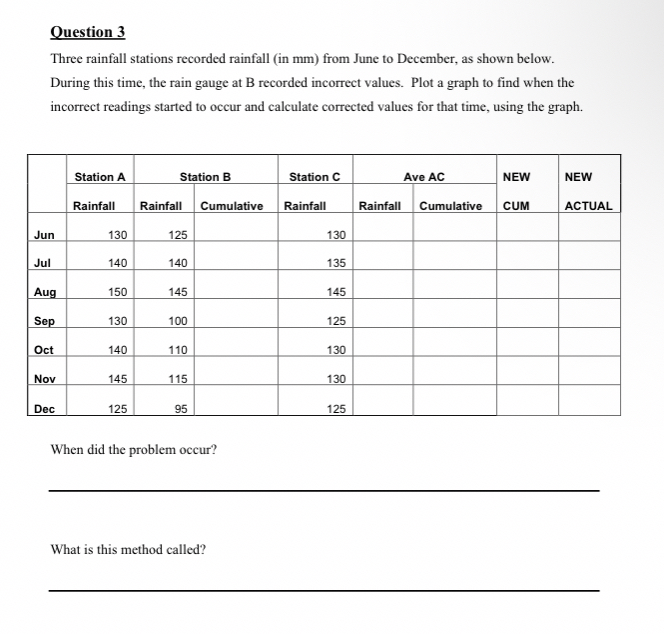
Three rainfall stations recorded rainfall in mm from June to December, as shown below. During this time, the rain gauge at B recorded incorrect values. Plot a graph to find when the incorrect readings started to occur and calculate corrected values for that time, using the graph.
tableStation AStation BStation CAve ACNEW,NEWRainfall,Rainfall,Cumulative,Rainfall,Rainfall,Cumulative,ACTUALJunJulAugSepOctNovDec
When did the problem occur?
What is this method called?
Step by Step Solution
There are 3 Steps involved in it
1 Expert Approved Answer
Step: 1 Unlock

Question Has Been Solved by an Expert!
Get step-by-step solutions from verified subject matter experts
Step: 2 Unlock
Step: 3 Unlock