

Question: Question 3 [Total = 10 marks] Consider the following relative-frequency histogram for the test mark distribution of a randomly selected class with 40 students. Test
![Question 3 [Total = 10 marks] Consider the following relative-frequency histogram](https://s3.amazonaws.com/si.experts.images/answers/2024/06/667aec36b679b_894667aec36832bc.jpg)
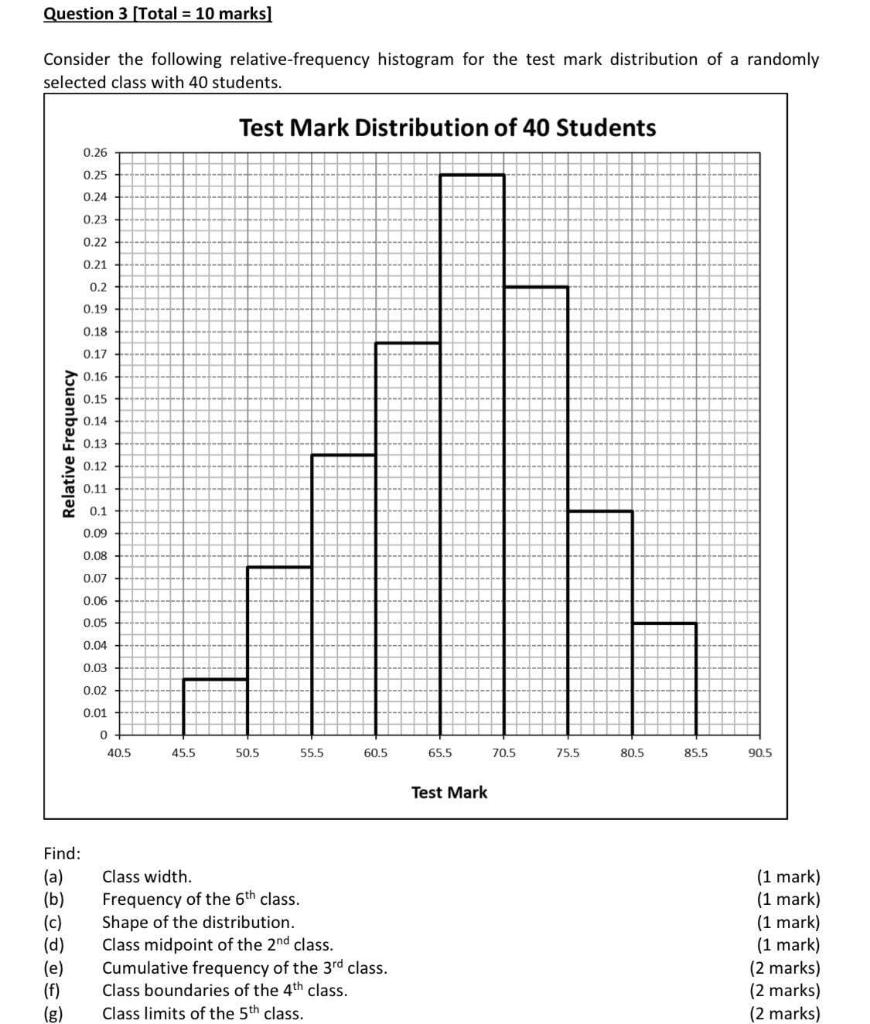
Question 3 [Total = 10 marks] Consider the following relative-frequency histogram for the test mark distribution of a randomly selected class with 40 students. Test Mark Distribution of 40 Students 0.26 0.25 0.24 0.23 0.22 0.21 0.2 0.19 0.18 0.17 0.16 0.15 0.14 Relative Frequency 0.13 0.12 0.11 0.1 0.09 0.08 0.07 0.06 0.05 0.04 0.03 0,02 0.01 40.5 15.5 50.5 55.5 60.5 65.5 70.5 75.5 80.5 85.5 90.5 Test Mark Find: (a) Class width. (1 mark) (b) Frequency of the 6th class. (1 mark) (c) Shape of the distribution. (1 mark) (d) Class midpoint of the 2nd class. (1 mark) (e) Cumulative frequency of the 3d class. (2 marks) (f ) Class boundaries of the 4th class. (2 marks) (8 ) Class limits of the 5th class. (2 marks)
Step by Step Solution
There are 3 Steps involved in it

Get step-by-step solutions from verified subject matter experts