

Question: Question 3: Use the historical financial data for Hershey's for 2021A to generate an estimate of the Additional Funds Needed and the Self-Supporting Growth Rate
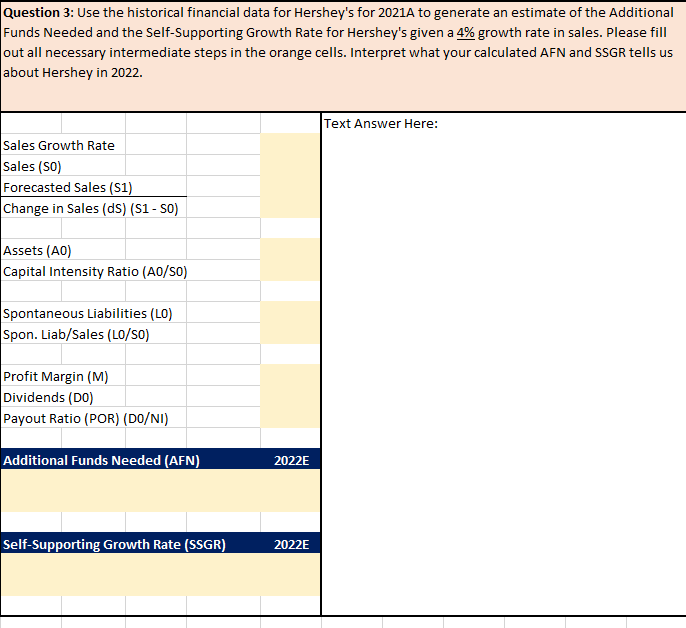
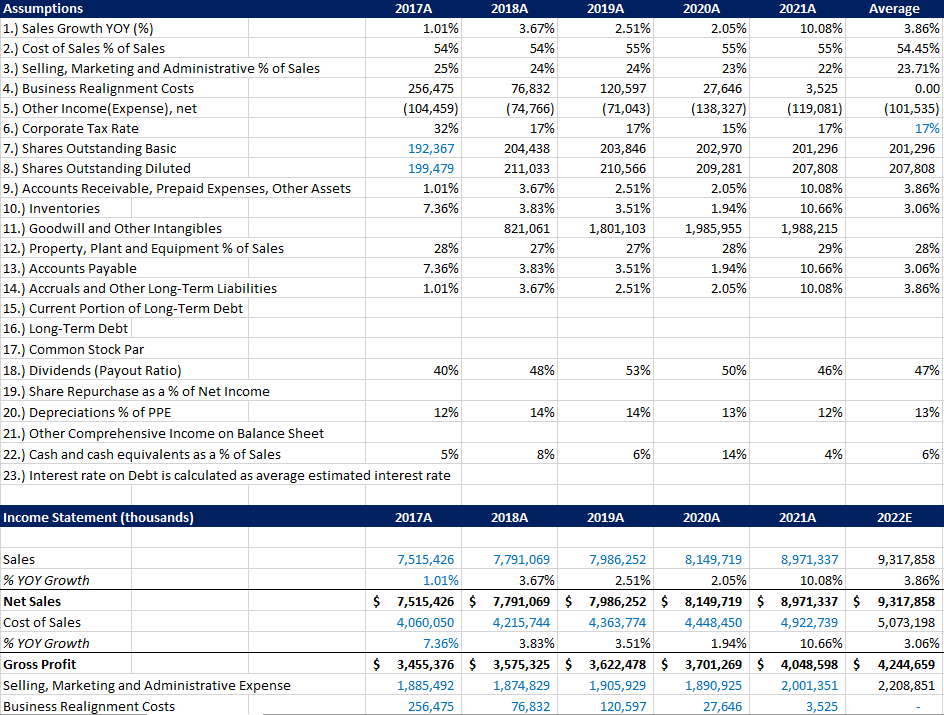
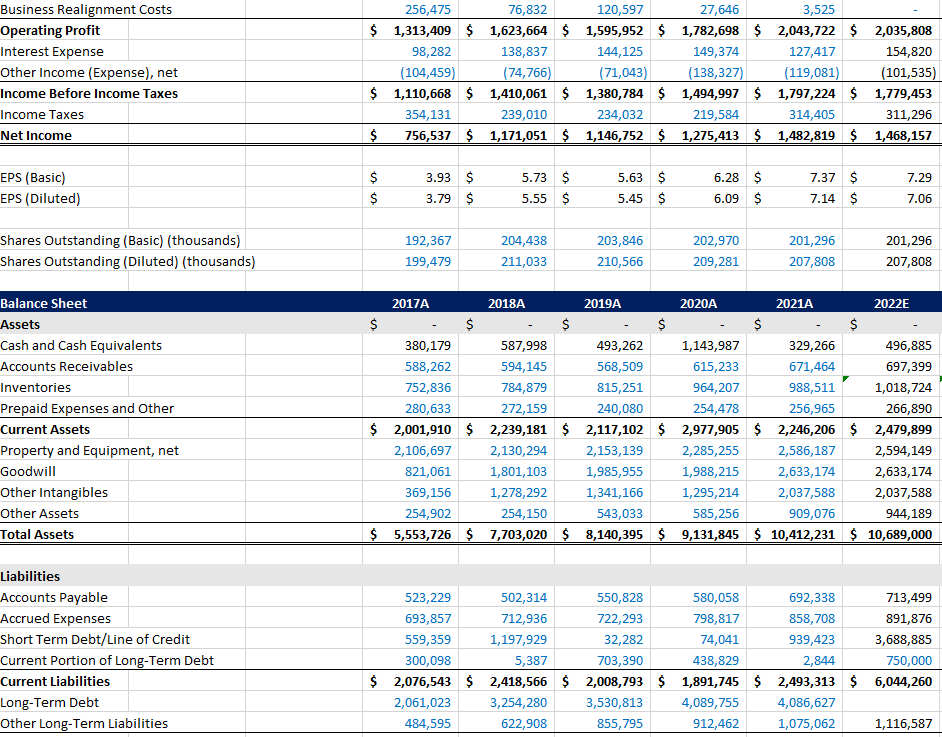
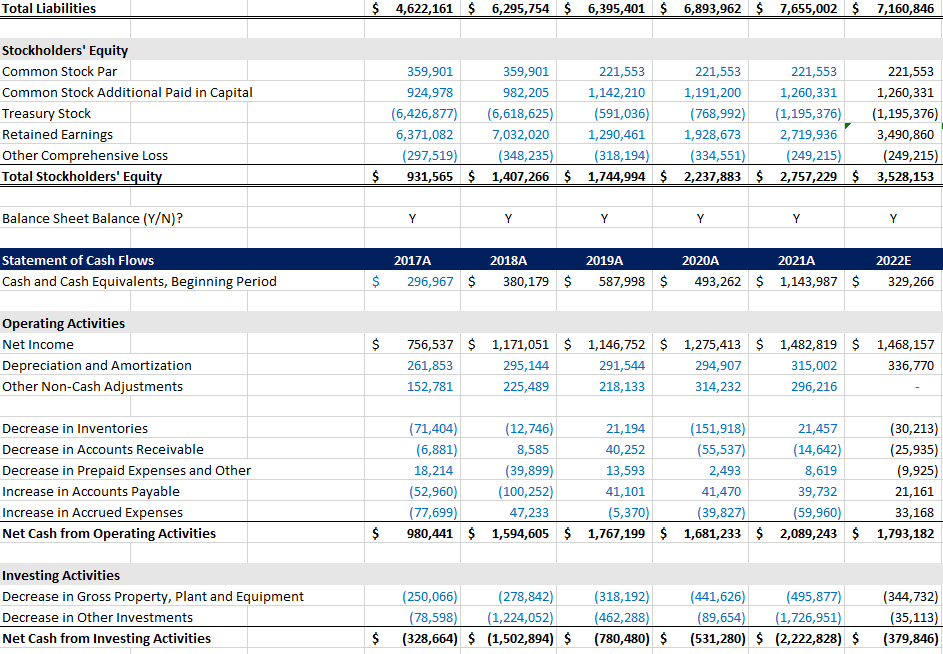
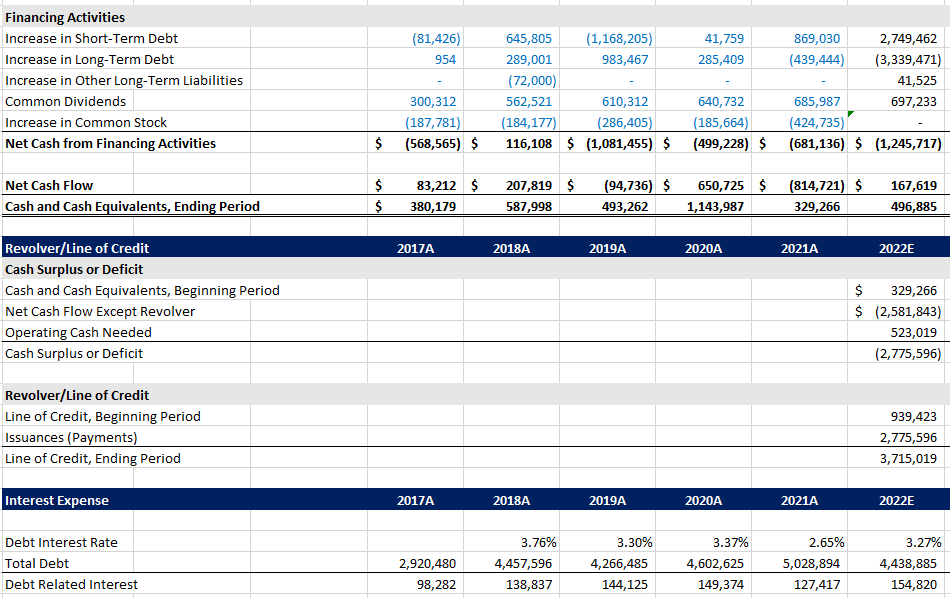
Question 3: Use the historical financial data for Hershey's for 2021A to generate an estimate of the Additional Funds Needed and the Self-Supporting Growth Rate for Hershey's given a 4% growth rate in sales. Please fill out all necessary intermediate steps in the orange cells. Interpret what your calculated AFN and SSGR tells us about Hershey in 2022. Text Answer Here: Sales Growth Rate Sales (SO) Forecasted Sales (51) Change in Sales (ds) (S1-SO) Assets (AO) Capital Intensity Ratio (AO/SO) Spontaneous Liabilities (LO) Spon. Liab/Sales (L0/SO) Profit Margin (M) Dividends (DO) Payout Ratio (POR) (DO/NI) Additional Funds Needed (AFN) 2022E Self-Supporting Growth Rate (SSGR) 2022E Assumptions 2017A 1.) Sales Growth YOY (%) 1.01% 2.) Cost of Sales % of Sales 54% 3.) Selling, Marketing and Administrative % of Sales 25% 4.) Business Realignment Costs 256,475 5.) Other Income(Expense), net (104,459) 6.) Corporate Tax Rate 32% 7.) Shares Outstanding Basic 192,367 8.) Shares Outstanding Diluted 199,479 9.) Accounts Receivable, Prepaid Expenses, Other Assets 1.01% 10.) Inventories 7.36% 11.) Goodwill and Other Intangibles 12.) Property, plant and Equipment % of Sales 28% 13.) Accounts Payable 7.36% 14.) Accruals and Other Long-Term Liabilities 1.01% 15.) Current Portion of Long-Term Debt 16.) Long-Term Debt 17.) Common Stock Par 18.) Dividends (Payout Ratio) 40% 19.) Share Repurchase as a % of Net Income 20.) Depreciations % of PPE 12% 21.) Other Comprehensive Income on Balance Sheet 22.) Cash and cash equivalents as a % of Sales 5% 23.) Interest rate on Debt is calculated as average estimated interest rate 2018A 3.67% 54% 24% 76,832 (74,766) 17% 204,438 211,033 3.67% 3.83% 821,061 27% 3.83% 3.67% 2019A 2.51% 55% 24% 120,597 (71,043) 17% 203,846 210,566 2.51% 3.51% 1,801,103 27% 3.51% 2.51% 2020A 2.05% 55% 23% 27,646 (138,327) 15% 202,970 209,281 2.05% 1.94% 1,985,955 28% 1.94% 2.05% 2021A 10.08% 55% 22% 3,525 (119,081) 17% 201,296 207,808 10.08% 10.66% 1,988,215 29% 10.66% 10.08% Average 3.86% 54.45% 23.71% 0.00 (101,535) 17% 201,296 207,808 3.86% 3.06% 28% 3.06% 3.86% 48% 53% 50% 46% 47% 14% 14% 13% 12% 13% 8% 6% 14% 4% 6% Income Statement (thousands) 2017A 2018A 2019A 2020A 2021A 2022E Sales % YOY Growth Net Sales Cost of Sales % YOY Growth Gross Profit Selling, Marketing and Administrative Expense Business Realignment Costs 7,515,426 7,791,069 7,986,252 8,149,719 8,971,337 9,317,858 1.01% 3.67% 2.51% 2.05% 10.08% 3.86% $ 7,515,426 $ 7,791,069 $ 7,986,252 $ 8,149,719 $ 8,971,337 $ 9,317,858 4,060,050 4,215,744 4,363,774 4,448,450 4,922,739 5,073,198 7.36% 3.83% 3.51% 1.94% 10.66% 3.06% $ 3,455,376 $ 3,575,325 $ 3,622,478 $ 3,701,269 $ 4,048,598 $ 4,244,659 1,885,492 1,874,829 1,905,929 1,890,925 2,001,351 2,208,851 256,475 76,832 120,597 27,646 3,525 Total Liabilities $ 4,622,161 $ 6,295,754 $ 6,395,401 $ 6,893,962 $ 7,655,002 $ 7,160,846 Stockholders' Equity Common Stock Par Common Stock Additional Paid in Capital Treasury Stock Retained Earnings Other Comprehensive Loss Total Stockholders' Equity 359,901 359,901 221,553 221,553 221,553 221,553 924,978 982,205 1,142,210 1,191,200 1,260,331 1,260,331 (6,426,877) (6,618,625) (591,036) (768,992) (1,195,376) (1,195,376) 6,371,082 7,032,020 1,290,461 1,928,673 2,719,936 3,490,860 (297,519) (348,235) (318,194) (334,551) (249,215) (249,215) 931,565 $ 1,407,266 $ 1,744,994 $ 2,237,883 $ 2,757,229 $ 3,528,153 $ Balance Sheet Balance (Y/N)? Y Y Y Y Y Y 2017A 2018A 2019A 2022E Statement of Cash Flows Cash and Cash Equivalents, Beginning Period 2020A 2021A 493,262 $ 1,143,987 $ $ 296,967 $ 380,179 $ 587,998 $ 329,266 $ Operating Activities Net Income Depreciation and Amortization Other Non-Cash Adjustments 756,537 $ 1,171,051 $ 1,146,752 $ 1,275,413 $ 1,482,819 $ 1,468,157 261,853 295,144 291,544 294,907 315,002 336,770 152,781 225,489 218,133 314,232 296,216 Decrease in Inventories Decrease in Accounts Receivable Decrease in Prepaid Expenses and Other Increase in Accounts Payable Increase in Accrued Expenses Net Cash from Operating Activities (71,404) (12,746) 21,194 (151,918) 21,457 (30,213) (6,881) 8,585 40,252 (55,537) (14,642) (25,935) 18,214 (39,899) 13,593 2,493 8,619 (9,925) (52,960) (100,252) 41,101 41,470 39,732 21,161 (77,699) 47,233 (5,370) (39,827) (59,960) 33,168 980,441 $ 1,594,605 $ 1,767,199 $ 1,681,233 $ 2,089,243 $ 1,793,182 $ Investing Activities Decrease in Gross Property, plant and Equipment Decrease in Other Investments Net Cash from Investing Activities (250,066) (278,842) (78,598) (1,224,052) (328,664) $ (1,502,894) $ (318,192) (462,288) (780,480) $ (441,626) (495,877) (89,654) (1,726,951) (531,280) $ (2,222,828) $ (344,732) (35,113) (379,846) $ Question 3: Use the historical financial data for Hershey's for 2021A to generate an estimate of the Additional Funds Needed and the Self-Supporting Growth Rate for Hershey's given a 4% growth rate in sales. Please fill out all necessary intermediate steps in the orange cells. Interpret what your calculated AFN and SSGR tells us about Hershey in 2022. Text Answer Here: Sales Growth Rate Sales (SO) Forecasted Sales (51) Change in Sales (ds) (S1-SO) Assets (AO) Capital Intensity Ratio (AO/SO) Spontaneous Liabilities (LO) Spon. Liab/Sales (L0/SO) Profit Margin (M) Dividends (DO) Payout Ratio (POR) (DO/NI) Additional Funds Needed (AFN) 2022E Self-Supporting Growth Rate (SSGR) 2022E Assumptions 2017A 1.) Sales Growth YOY (%) 1.01% 2.) Cost of Sales % of Sales 54% 3.) Selling, Marketing and Administrative % of Sales 25% 4.) Business Realignment Costs 256,475 5.) Other Income(Expense), net (104,459) 6.) Corporate Tax Rate 32% 7.) Shares Outstanding Basic 192,367 8.) Shares Outstanding Diluted 199,479 9.) Accounts Receivable, Prepaid Expenses, Other Assets 1.01% 10.) Inventories 7.36% 11.) Goodwill and Other Intangibles 12.) Property, plant and Equipment % of Sales 28% 13.) Accounts Payable 7.36% 14.) Accruals and Other Long-Term Liabilities 1.01% 15.) Current Portion of Long-Term Debt 16.) Long-Term Debt 17.) Common Stock Par 18.) Dividends (Payout Ratio) 40% 19.) Share Repurchase as a % of Net Income 20.) Depreciations % of PPE 12% 21.) Other Comprehensive Income on Balance Sheet 22.) Cash and cash equivalents as a % of Sales 5% 23.) Interest rate on Debt is calculated as average estimated interest rate 2018A 3.67% 54% 24% 76,832 (74,766) 17% 204,438 211,033 3.67% 3.83% 821,061 27% 3.83% 3.67% 2019A 2.51% 55% 24% 120,597 (71,043) 17% 203,846 210,566 2.51% 3.51% 1,801,103 27% 3.51% 2.51% 2020A 2.05% 55% 23% 27,646 (138,327) 15% 202,970 209,281 2.05% 1.94% 1,985,955 28% 1.94% 2.05% 2021A 10.08% 55% 22% 3,525 (119,081) 17% 201,296 207,808 10.08% 10.66% 1,988,215 29% 10.66% 10.08% Average 3.86% 54.45% 23.71% 0.00 (101,535) 17% 201,296 207,808 3.86% 3.06% 28% 3.06% 3.86% 48% 53% 50% 46% 47% 14% 14% 13% 12% 13% 8% 6% 14% 4% 6% Income Statement (thousands) 2017A 2018A 2019A 2020A 2021A 2022E Sales % YOY Growth Net Sales Cost of Sales % YOY Growth Gross Profit Selling, Marketing and Administrative Expense Business Realignment Costs 7,515,426 7,791,069 7,986,252 8,149,719 8,971,337 9,317,858 1.01% 3.67% 2.51% 2.05% 10.08% 3.86% $ 7,515,426 $ 7,791,069 $ 7,986,252 $ 8,149,719 $ 8,971,337 $ 9,317,858 4,060,050 4,215,744 4,363,774 4,448,450 4,922,739 5,073,198 7.36% 3.83% 3.51% 1.94% 10.66% 3.06% $ 3,455,376 $ 3,575,325 $ 3,622,478 $ 3,701,269 $ 4,048,598 $ 4,244,659 1,885,492 1,874,829 1,905,929 1,890,925 2,001,351 2,208,851 256,475 76,832 120,597 27,646 3,525 Total Liabilities $ 4,622,161 $ 6,295,754 $ 6,395,401 $ 6,893,962 $ 7,655,002 $ 7,160,846 Stockholders' Equity Common Stock Par Common Stock Additional Paid in Capital Treasury Stock Retained Earnings Other Comprehensive Loss Total Stockholders' Equity 359,901 359,901 221,553 221,553 221,553 221,553 924,978 982,205 1,142,210 1,191,200 1,260,331 1,260,331 (6,426,877) (6,618,625) (591,036) (768,992) (1,195,376) (1,195,376) 6,371,082 7,032,020 1,290,461 1,928,673 2,719,936 3,490,860 (297,519) (348,235) (318,194) (334,551) (249,215) (249,215) 931,565 $ 1,407,266 $ 1,744,994 $ 2,237,883 $ 2,757,229 $ 3,528,153 $ Balance Sheet Balance (Y/N)? Y Y Y Y Y Y 2017A 2018A 2019A 2022E Statement of Cash Flows Cash and Cash Equivalents, Beginning Period 2020A 2021A 493,262 $ 1,143,987 $ $ 296,967 $ 380,179 $ 587,998 $ 329,266 $ Operating Activities Net Income Depreciation and Amortization Other Non-Cash Adjustments 756,537 $ 1,171,051 $ 1,146,752 $ 1,275,413 $ 1,482,819 $ 1,468,157 261,853 295,144 291,544 294,907 315,002 336,770 152,781 225,489 218,133 314,232 296,216 Decrease in Inventories Decrease in Accounts Receivable Decrease in Prepaid Expenses and Other Increase in Accounts Payable Increase in Accrued Expenses Net Cash from Operating Activities (71,404) (12,746) 21,194 (151,918) 21,457 (30,213) (6,881) 8,585 40,252 (55,537) (14,642) (25,935) 18,214 (39,899) 13,593 2,493 8,619 (9,925) (52,960) (100,252) 41,101 41,470 39,732 21,161 (77,699) 47,233 (5,370) (39,827) (59,960) 33,168 980,441 $ 1,594,605 $ 1,767,199 $ 1,681,233 $ 2,089,243 $ 1,793,182 $ Investing Activities Decrease in Gross Property, plant and Equipment Decrease in Other Investments Net Cash from Investing Activities (250,066) (278,842) (78,598) (1,224,052) (328,664) $ (1,502,894) $ (318,192) (462,288) (780,480) $ (441,626) (495,877) (89,654) (1,726,951) (531,280) $ (2,222,828) $ (344,732) (35,113) (379,846) $
Step by Step Solution
There are 3 Steps involved in it

Get step-by-step solutions from verified subject matter experts