

Question: Question 3. Using Excel, calculate the descriptive statistics (mean, standard deviation, and five number summary) of your data set. If your research question is
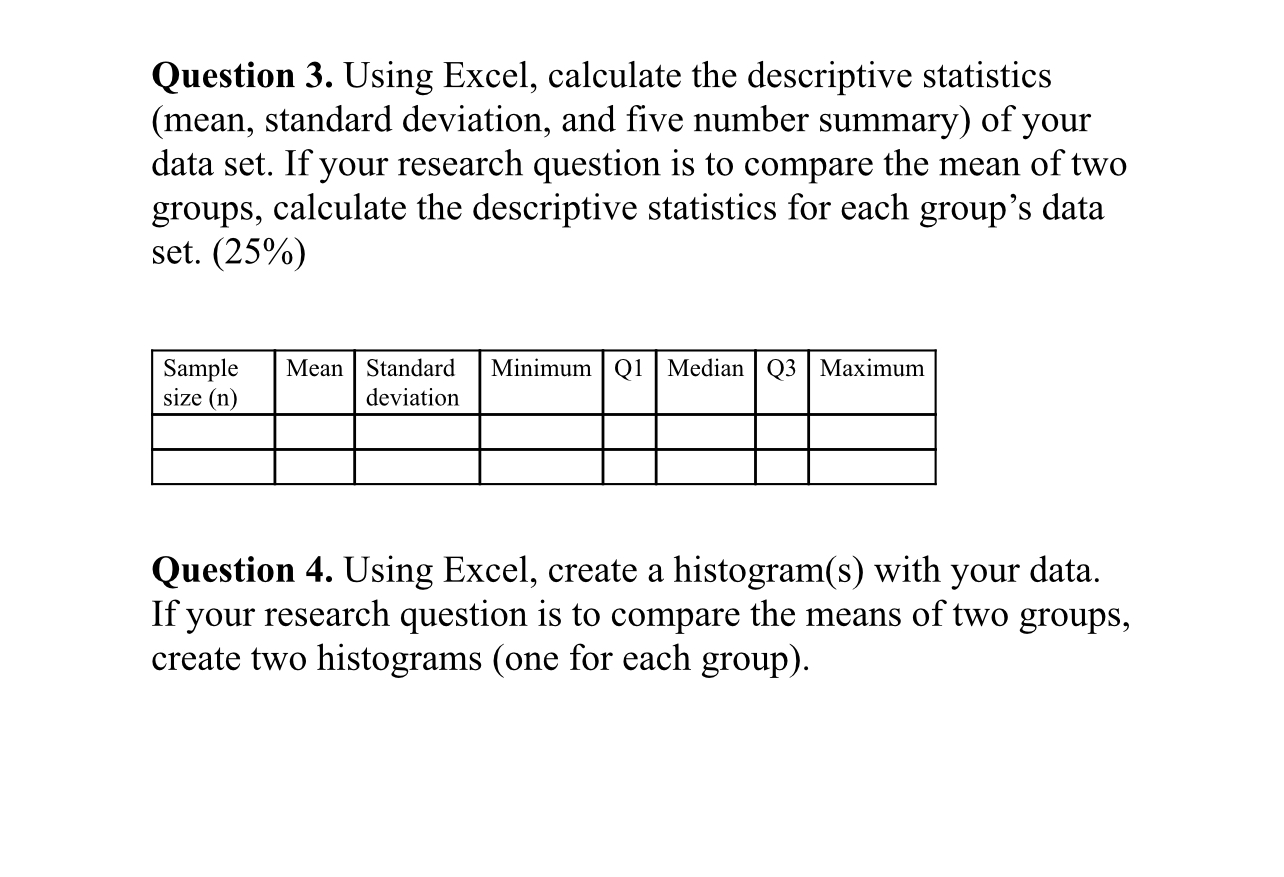
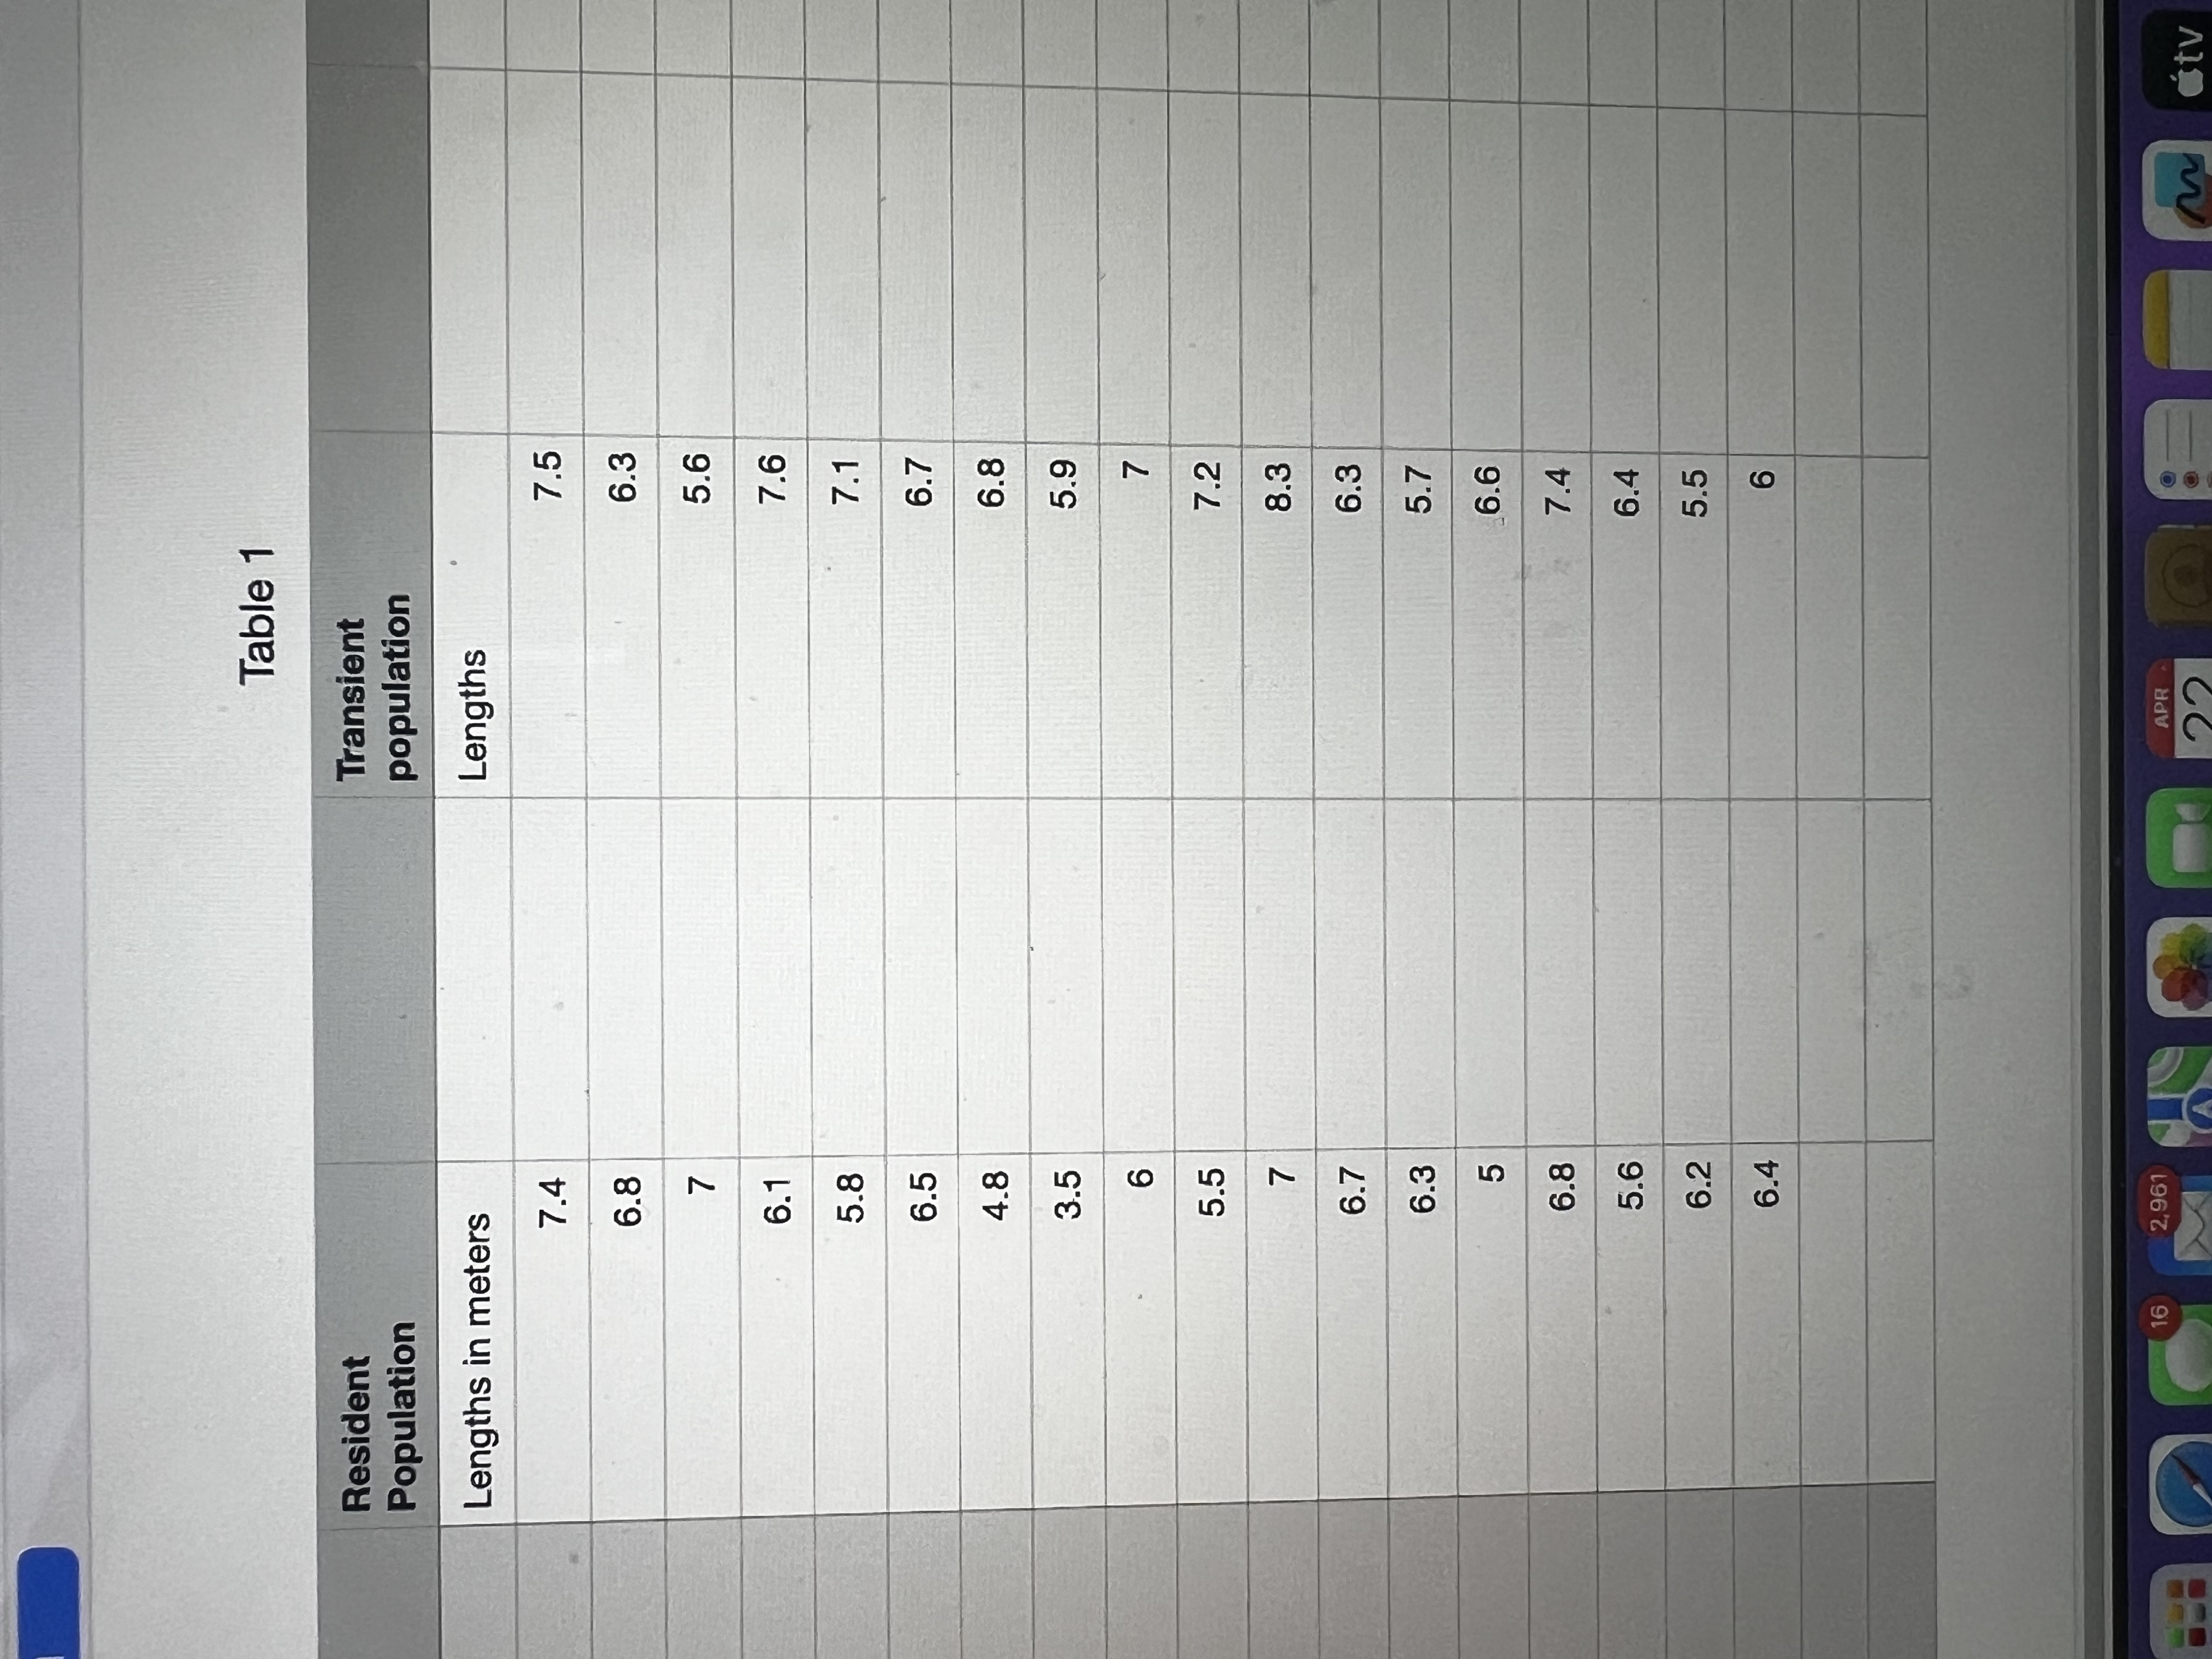
Question 3. Using Excel, calculate the descriptive statistics (mean, standard deviation, and five number summary) of your data set. If your research question is to compare the mean of two groups, calculate the descriptive statistics for each group's data set. (25%) Sample size (n) Mean Standard Minimum Q1 Median Q3 | Maximum deviation Question 4. Using Excel, create a histogram(s) with your data. If your research question is to compare the means of two groups, create two histograms (one for each group). Resident Population Lengths in meters Table 1 Transient population Lengths 7.4 7.5 6.8 6.3 7 5.6 6.1 7.6 5.8 7.1 6.5 6.7 4.8 6.8 3.5 5.9 6 7 5.5 7.2 7 8.3 6.7 6.3 6.3 5.7 5 6.6 6.8 7.4 5.6 6.4 6.2 5.5 6.4 6 16 2,961 APR 22 tv
Step by Step Solution
There are 3 Steps involved in it

Get step-by-step solutions from verified subject matter experts