Question: Question 3 Using the multiple regression output below, determine the following: Repression Statistics Multiple R 0459837234 R Square 0211450282 Adjusted R Square 0.193364279 Standard Error
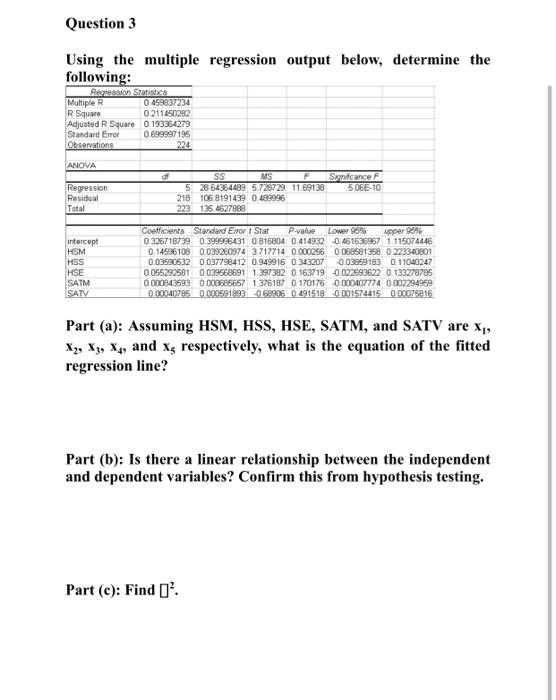
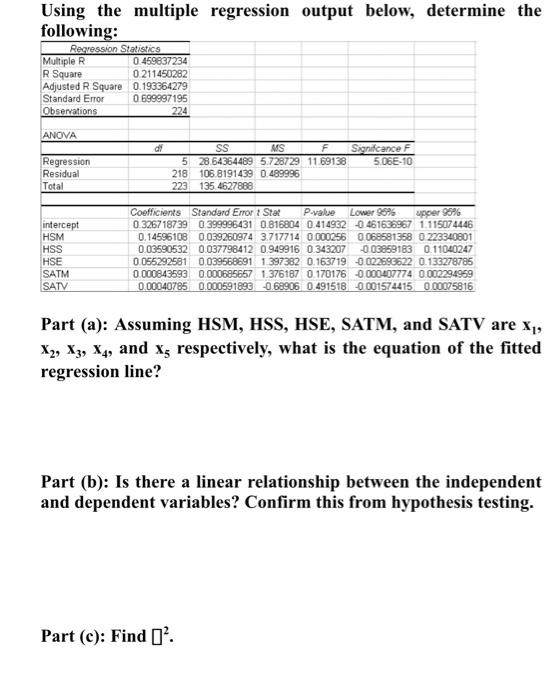
Question 3 Using the multiple regression output below, determine the following: Repression Statistics Multiple R 0459837234 R Square 0211450282 Adjusted R Square 0.193364279 Standard Error 0899997195 Observations 224 ANOVA Sancace F 506E-10 Regression Residual Total SS MS F 5 28.64364489 5.728729 1169138 218 106 8191439 0429996 223 135.4627899 er 9696 intercept HSM HSS HSE SATM SATV Coefficients Standard Emort Stat P-value Lower 90% 0326718739 0.399996431 0.816804 0.414932 -0.461536967 1.115074446 0.14596108 0.039260974 3717714 0.000256 0.068581358 0223340801 0.03590532 0.037798412 0 949916 0 343207 003859183 0.11040247 0055292581 0.039568691 1.397382 0.163719 -0.022693622 0.133278785 0.000843699 0000886667 1376187 0 170176 0000407774 0.002294959 0.00040785 0.000591893 098906 D 491518 0 001574415 000075816 Part (a): Assuming HSM, HSS, HSE, SATM, and SATV are xp X2, X3, X, and xs respectively, what is the equation of the fitted regression line? Part (b): Is there a linear relationship between the independent and dependent variables? Confirm this from hypothesis testing. Part (e): Find 0? Using the multiple regression output below, determine the following: Regression Statistics Multiple R 0.459837234 R Square 0.211450282 Adjusted R Square 0.193364279 Standard Error 0 699997195 Observations 224 ANOVA d! Significance F 506E-10 Regression Residual Total SS MS F 5 28.64364489 5.728729 11.69138 218 106.8191439 0.489996 223 135.4627888 per 9596 intercept HSM HSS HSE SATM SATV Coefficients Standard Error 1 Stat P-value Lower 95% 0.326718739 0399996431 0.816804 0.414932 - 461636967 1.115074446 0.14596108 0.039260974 3.717714 0.000256 0.068581358 0.223340801 0.03590532 0.037798412 0.949916 0.343207 -0.03859183 0.11040247 0.055292581 0.039568691 1 397382 0.163719 -0.002693622 0.133278785 0.000843593 0.000685657 1.376187 0.170176 -0.000407774 0.002294959 0.00040785 0.000591893 -0.68906 0.491518 -0.001574415 0.00075816 Part (a): Assuming HSM, HSS, HSE, SATM, and SATV are x1, X2, X3, X4, and xs respectively, what is the equation of the fitted regression line? Part (b): Is there a linear relationship between the independent and dependent variables? Confirm this from hypothesis testing. Part (c): Find [