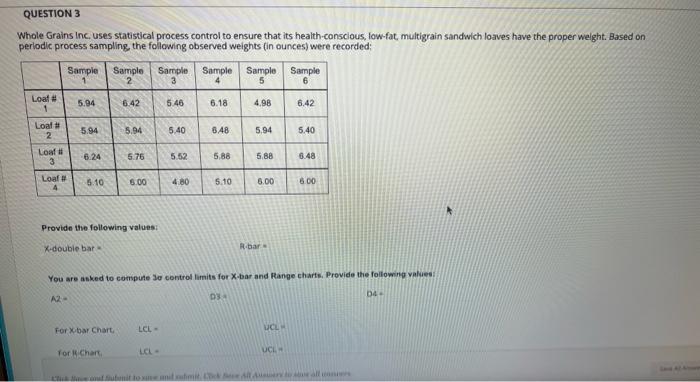
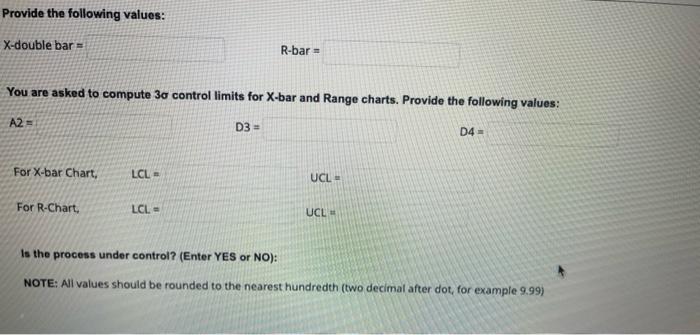
Question: QUESTION 3 Whole Grains Inc, uses statistical process control to ensure that its health-conscious, low-fat, multigrain sandwich loaves have the proper weight. Based on periodic

QUESTION 3 Whole Grains Inc, uses statistical
QUESTION 3 Whole Grains Inc, uses statistical process control to ensure that its health-conscious, low-fat, multigrain sandwich loaves have the proper weight. Based on periodic process sampling, the following observed weights (in ounces) were recorded: Sample Sample 2 Sample Sample 4 Sample 5 3 Sample 6 - Loaf # 1 5.94 6.42 5.46 6.18 4.98 6.42 Loal 2 5.94 5.94 5.40 8.48 5.94 5.40 6.24 5.76 5.52 5.88 5.88 6.48 Loaf 3 Loaf 4 5.10 5.00 4.80 5.10 6.00 6.00 Provide the following values X-double bar Ribar You are asked to compute de controllimits for X-bar and Range charts. Provide the following value DA 04 A2- LEL- UCL For X bar Chart Tor Chart LCL UCL Provide the following values: X-double bar- R-bar = You are asked to compute 30 control limits for X-bar and Range charts. Provide the following values: A2 = D3 D4 For X-bar Chart, LCL UCL For R-Chart. LCL UCL Is the process under control? (Enter YES or NO): NOTE: All values should be rounded to the nearest hundredth (two decimal after dot, for example 9.99)

Step by Step Solution

There are 3 Steps involved in it

1 Expert Approved Answer
Step: 1 Unlock blur-text-image
Question Has Been Solved by an Expert!

Get step-by-step solutions from verified subject matter experts

Step: 2 Unlock
Step: 3 Unlock

Students Have Also Explored These Related General Management Questions!