

Question: Question 3: You are examining quarterly demand data for a high-margin, growing demand product. The data can be found in the graphic below: a) What
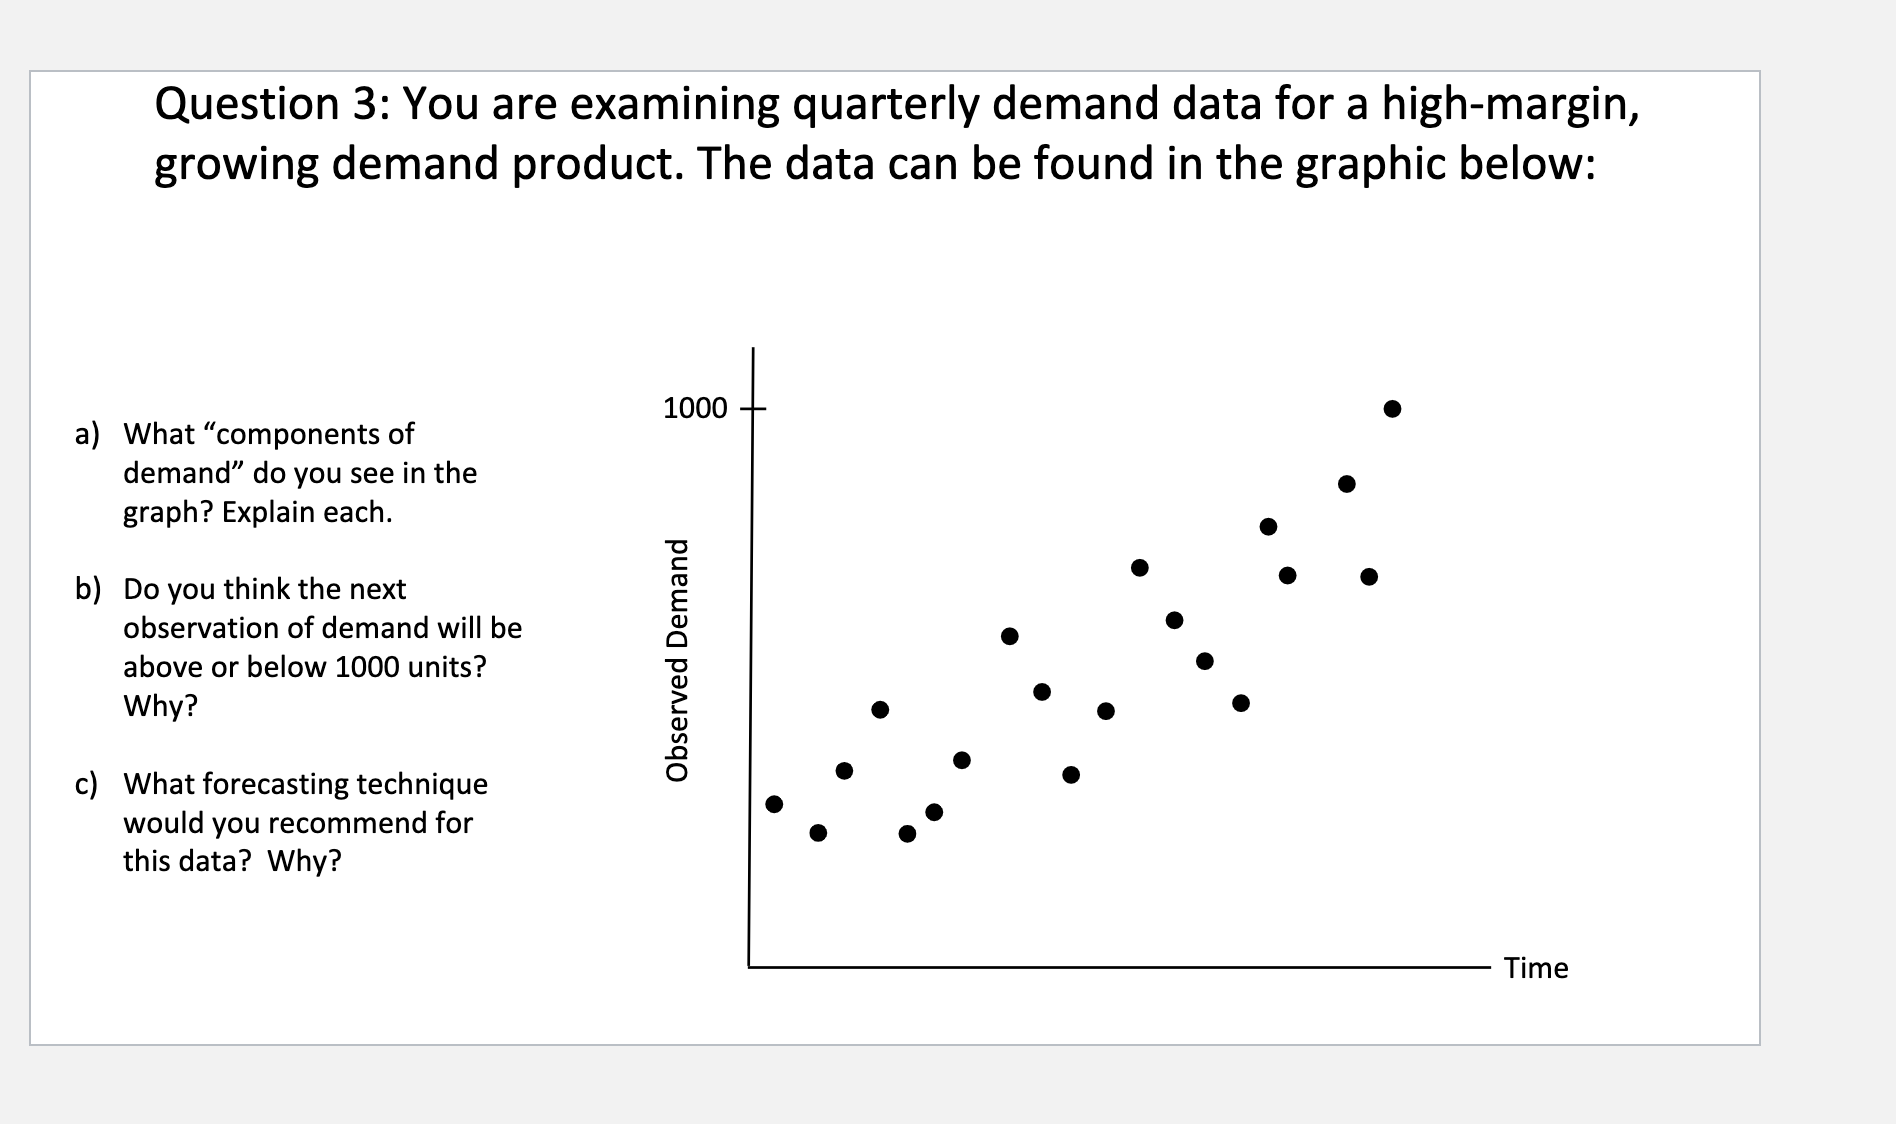
Question 3: You are examining quarterly demand data for a high-margin, growing demand product. The data can be found in the graphic below: a) What "components of demand" do you see in the graph? Explain each. b) Do you think the next observation of demand will be above or below 1000 units? Why? c) What forecasting technique would you recommend for this data? Why
Step by Step Solution
There are 3 Steps involved in it
1 Expert Approved Answer
Step: 1 Unlock

Question Has Been Solved by an Expert!
Get step-by-step solutions from verified subject matter experts
Step: 2 Unlock
Step: 3 Unlock