

Question: Question 3 : You are provided with cell _ viability.csv file that contains the results from the cell viability assay that recorded the percent of
Question :
You are provided with cellviability.csv file that contains the results from the cell viability assay that
recorded the percent of cell viabilities with three drugs treatments.
a Read the table into cell.via dataframe
b Write a function calculatemeanviability to calculate mean viability for each drug treatment. When
you call the function calculatemeanviability cellvia it should print the mean viability of each drug
treatment.
c Write a Function calculatesdviability to calculate standard deviation of viability for each drug
treatment. When you call the function calculatesdviabilitycellvia it should print the standard
deviation of each drug treatment.
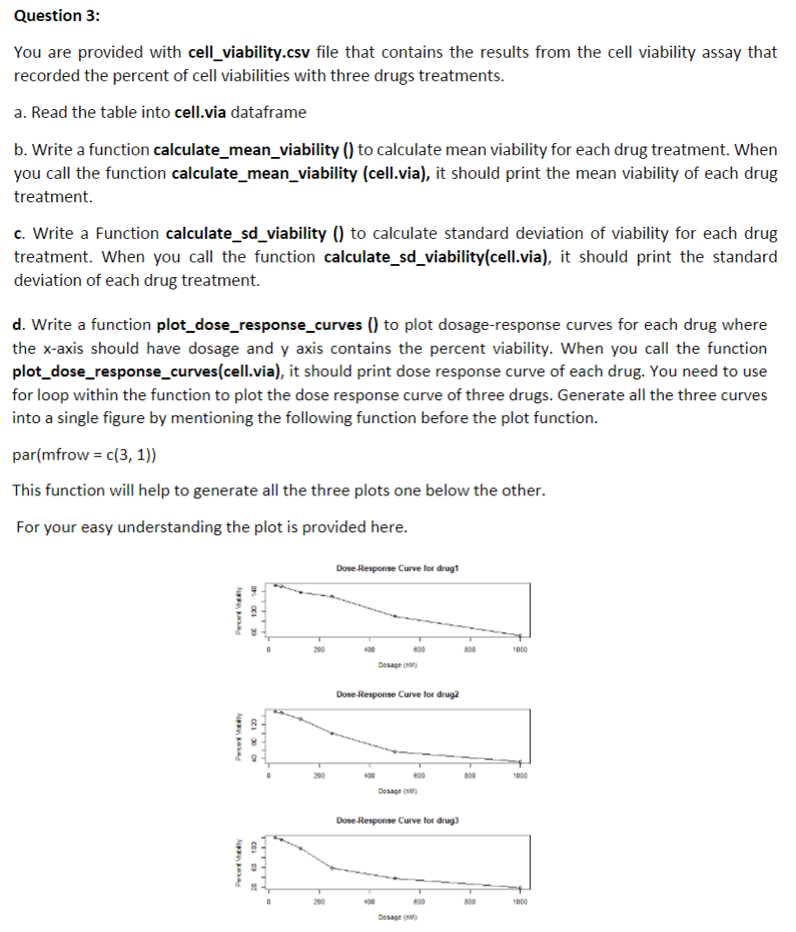
d Write a function plotdoseresponsecurves to plot dosageresponse curves for each drug where
the axis should have dosage and axis contains the percent viability. When you call the function
plotdoseresponsecurvescellvia it should print dose response curve of each drug. You need to use
for loop within the function to plot the dose response curve of three drugs. Generate all the three curves
into a single figure by mentioning the following function before the plot function.
par
This function will help to generate all the three plots one below the other.
For your easy understanding the plot is provided here.
Step by Step Solution
There are 3 Steps involved in it
1 Expert Approved Answer
Step: 1 Unlock

Question Has Been Solved by an Expert!
Get step-by-step solutions from verified subject matter experts
Step: 2 Unlock
Step: 3 Unlock