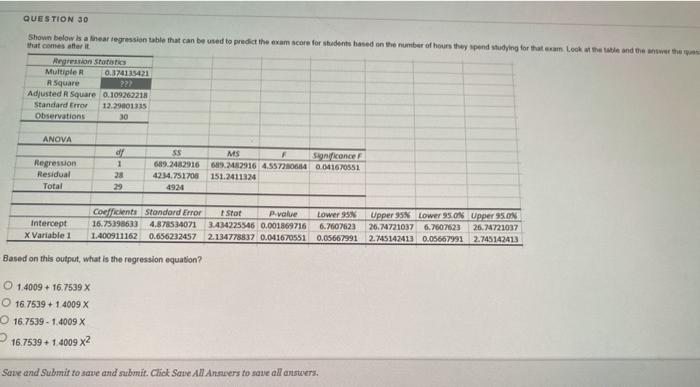
Question: QUESTION 30 Shown below is a linear regression table that can be used to predict the exam score for shudents based on the number of

QUESTION 30 Shown below is a linear regression
QUESTION 30 Shown below is a linear regression table that can be used to predict the exam score for shudents based on the number of hours they end studying for that can look at the table and the whether that comes after it 721 Regression Statistics Multiple 0.374115421 R Square Adjusted R Square 0.109262213 Standard Error 12.29001335 Observations 30 ANOVA Regression Residual Total of 1 28 29 55 689.2402916 424.751700 4924 MS Significance 689.282916 4.55724 0.041670551 151.2411324 Intercept X Variable 1 Coefficient Standard Error Stot P.value Lower 95 16.75398633 4,878534071 3.434225546 0.001869716 6.7607623 1.400911162 0.656232457 2.134778837 0.041670551 0.05667991 Upper 358 Lower 95.0 Upper 95.0 26.74721037 6.7607523 26.74721037 2.745142413 0.05667991 2.745142413 Based on this output, what is the regression equation? O 1.4009 + 16.7539 X O 16.7539 + 1 4009 X 16.7539 - 1.4009 X 16.7539 + 1.4009 X2 Save and Submit to save and submit. Click Save All Ansers to save all answers

Step by Step Solution

There are 3 Steps involved in it

1 Expert Approved Answer
Step: 1 Unlock blur-text-image
Question Has Been Solved by an Expert!

Get step-by-step solutions from verified subject matter experts

Step: 2 Unlock
Step: 3 Unlock

Students Have Also Explored These Related General Management Questions!