

Question: Question 31 7 pts Figure 1 shows the experiment setup of a simple RL circuit. Figure 2 and Figure 3 are Capstone experiment data of
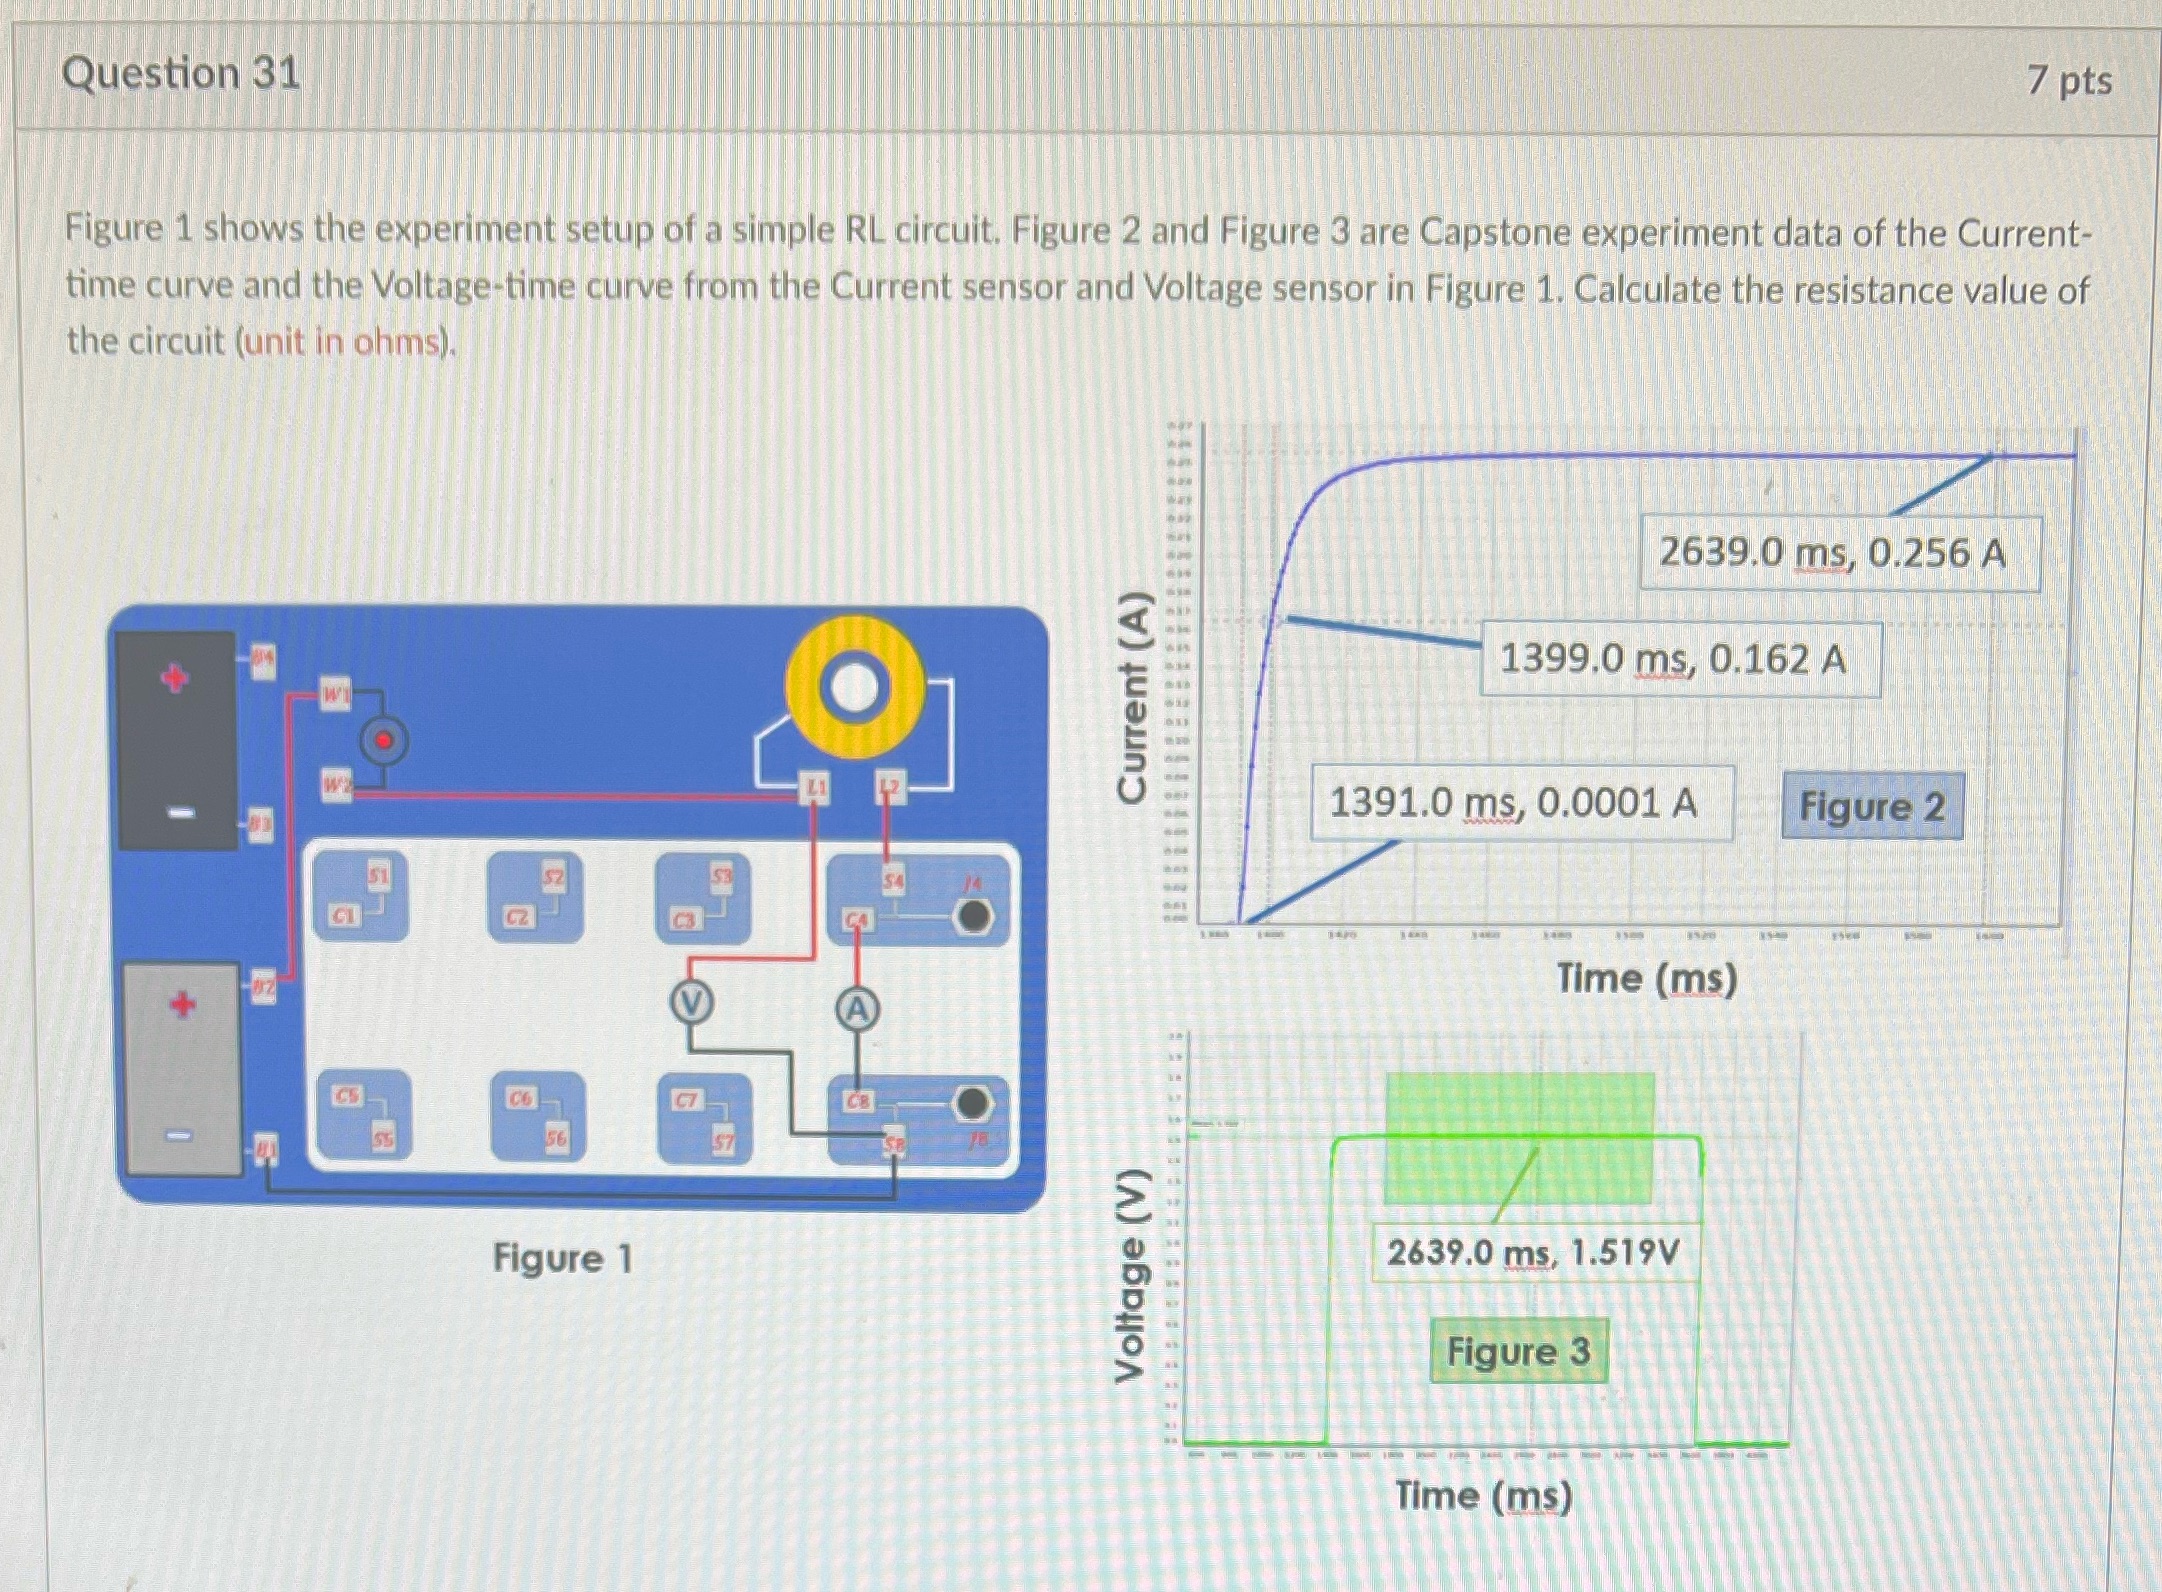
Question 31 7 pts Figure 1 shows the experiment setup of a simple RL circuit. Figure 2 and Figure 3 are Capstone experiment data of the Current- time curve and the Voltage-time curve from the Current sensor and Voltage sensor in Figure 1. Calculate the resistance value of the circuit (unit in ohms). 2639.0 ms, 0.256 A 1399.0 ms, 0.162 A O Current (A) W 1391.0 ms, 0.0001 A Figure 2 51 CZ Ca GA Time (ms) CS C6 C7 CB 56 57 Figure 1 2639.0 ms, 1.519V Voltage (V) Figure 3 Time (ms)
Step by Step Solution
There are 3 Steps involved in it
1 Expert Approved Answer
Step: 1 Unlock

Question Has Been Solved by an Expert!
Get step-by-step solutions from verified subject matter experts
Step: 2 Unlock
Step: 3 Unlock