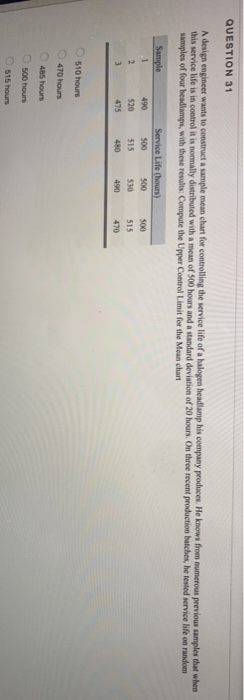
Question: QUESTION 31 A design engineer wants to construct a sample mean chart for controlling the service life of a halogen headlamp his company produces. He

QUESTION 31 A design engineer wants to construct
QUESTION 31 A design engineer wants to construct a sample mean chart for controlling the service life of a halogen headlamp his company produces. He knows from numerous previous samples that when this service life is in control it is normally distributed with a mean of 500 hours and a standard deviation of 20 hours. On three recent production batches, he tested service life on random samples of four headlamps, with these results: Compute the Upper Control Limit for the Mean chart Sample 1 2 3 490 520 475 Service Life (hours) 500 500 515 530 490 500 515 470 510 hours 470 hours 485 hours 500 hours 515 hours QUESTION 35 A quality analyst wants to construct a control chart for determining whether four machines, all producing the same product, are in control with regard to a particular quality attribute. Accordingly, she inspected 800 units of output from each machine in random samples, with the following results: Compute the Control Limits for the following data, assuming a 95 percent Confidence Level: Machine I #2 #3 Total Defectives 40 35 29 23 114 0.023, 0.078 0.026, 0.054 0.0115,0.954 0.0058, 0.012 E.D .005 0.134

Step by Step Solution

There are 3 Steps involved in it

1 Expert Approved Answer
Step: 1 Unlock blur-text-image
Question Has Been Solved by an Expert!

Get step-by-step solutions from verified subject matter experts

Step: 2 Unlock
Step: 3 Unlock

Students Have Also Explored These Related General Management Questions!