

Question: QUESTION 31 In the diagram, 1, 2, 3 represent sampling distributions of three statistics that might be used to estimate the parameter identified. Identify the
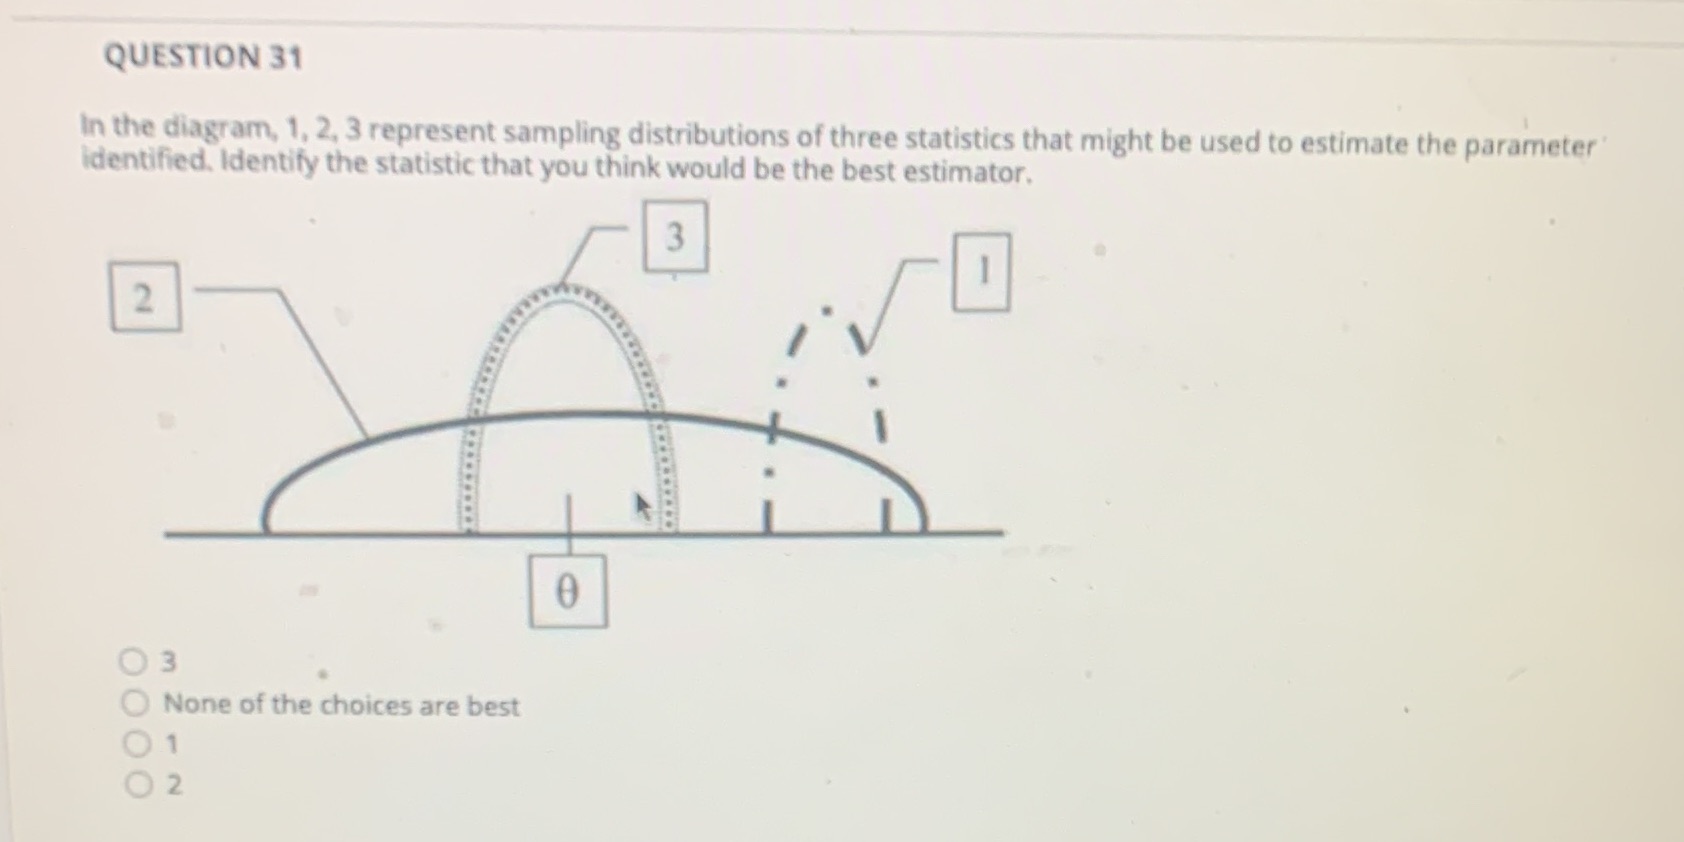
QUESTION 31 In the diagram, 1, 2, 3 represent sampling distributions of three statistics that might be used to estimate the parameter identified. Identify the statistic that you think would be the best estimator. 2 0 3 None of the choices are best O O
Step by Step Solution
There are 3 Steps involved in it
1 Expert Approved Answer
Step: 1 Unlock

Question Has Been Solved by an Expert!
Get step-by-step solutions from verified subject matter experts
Step: 2 Unlock
Step: 3 Unlock