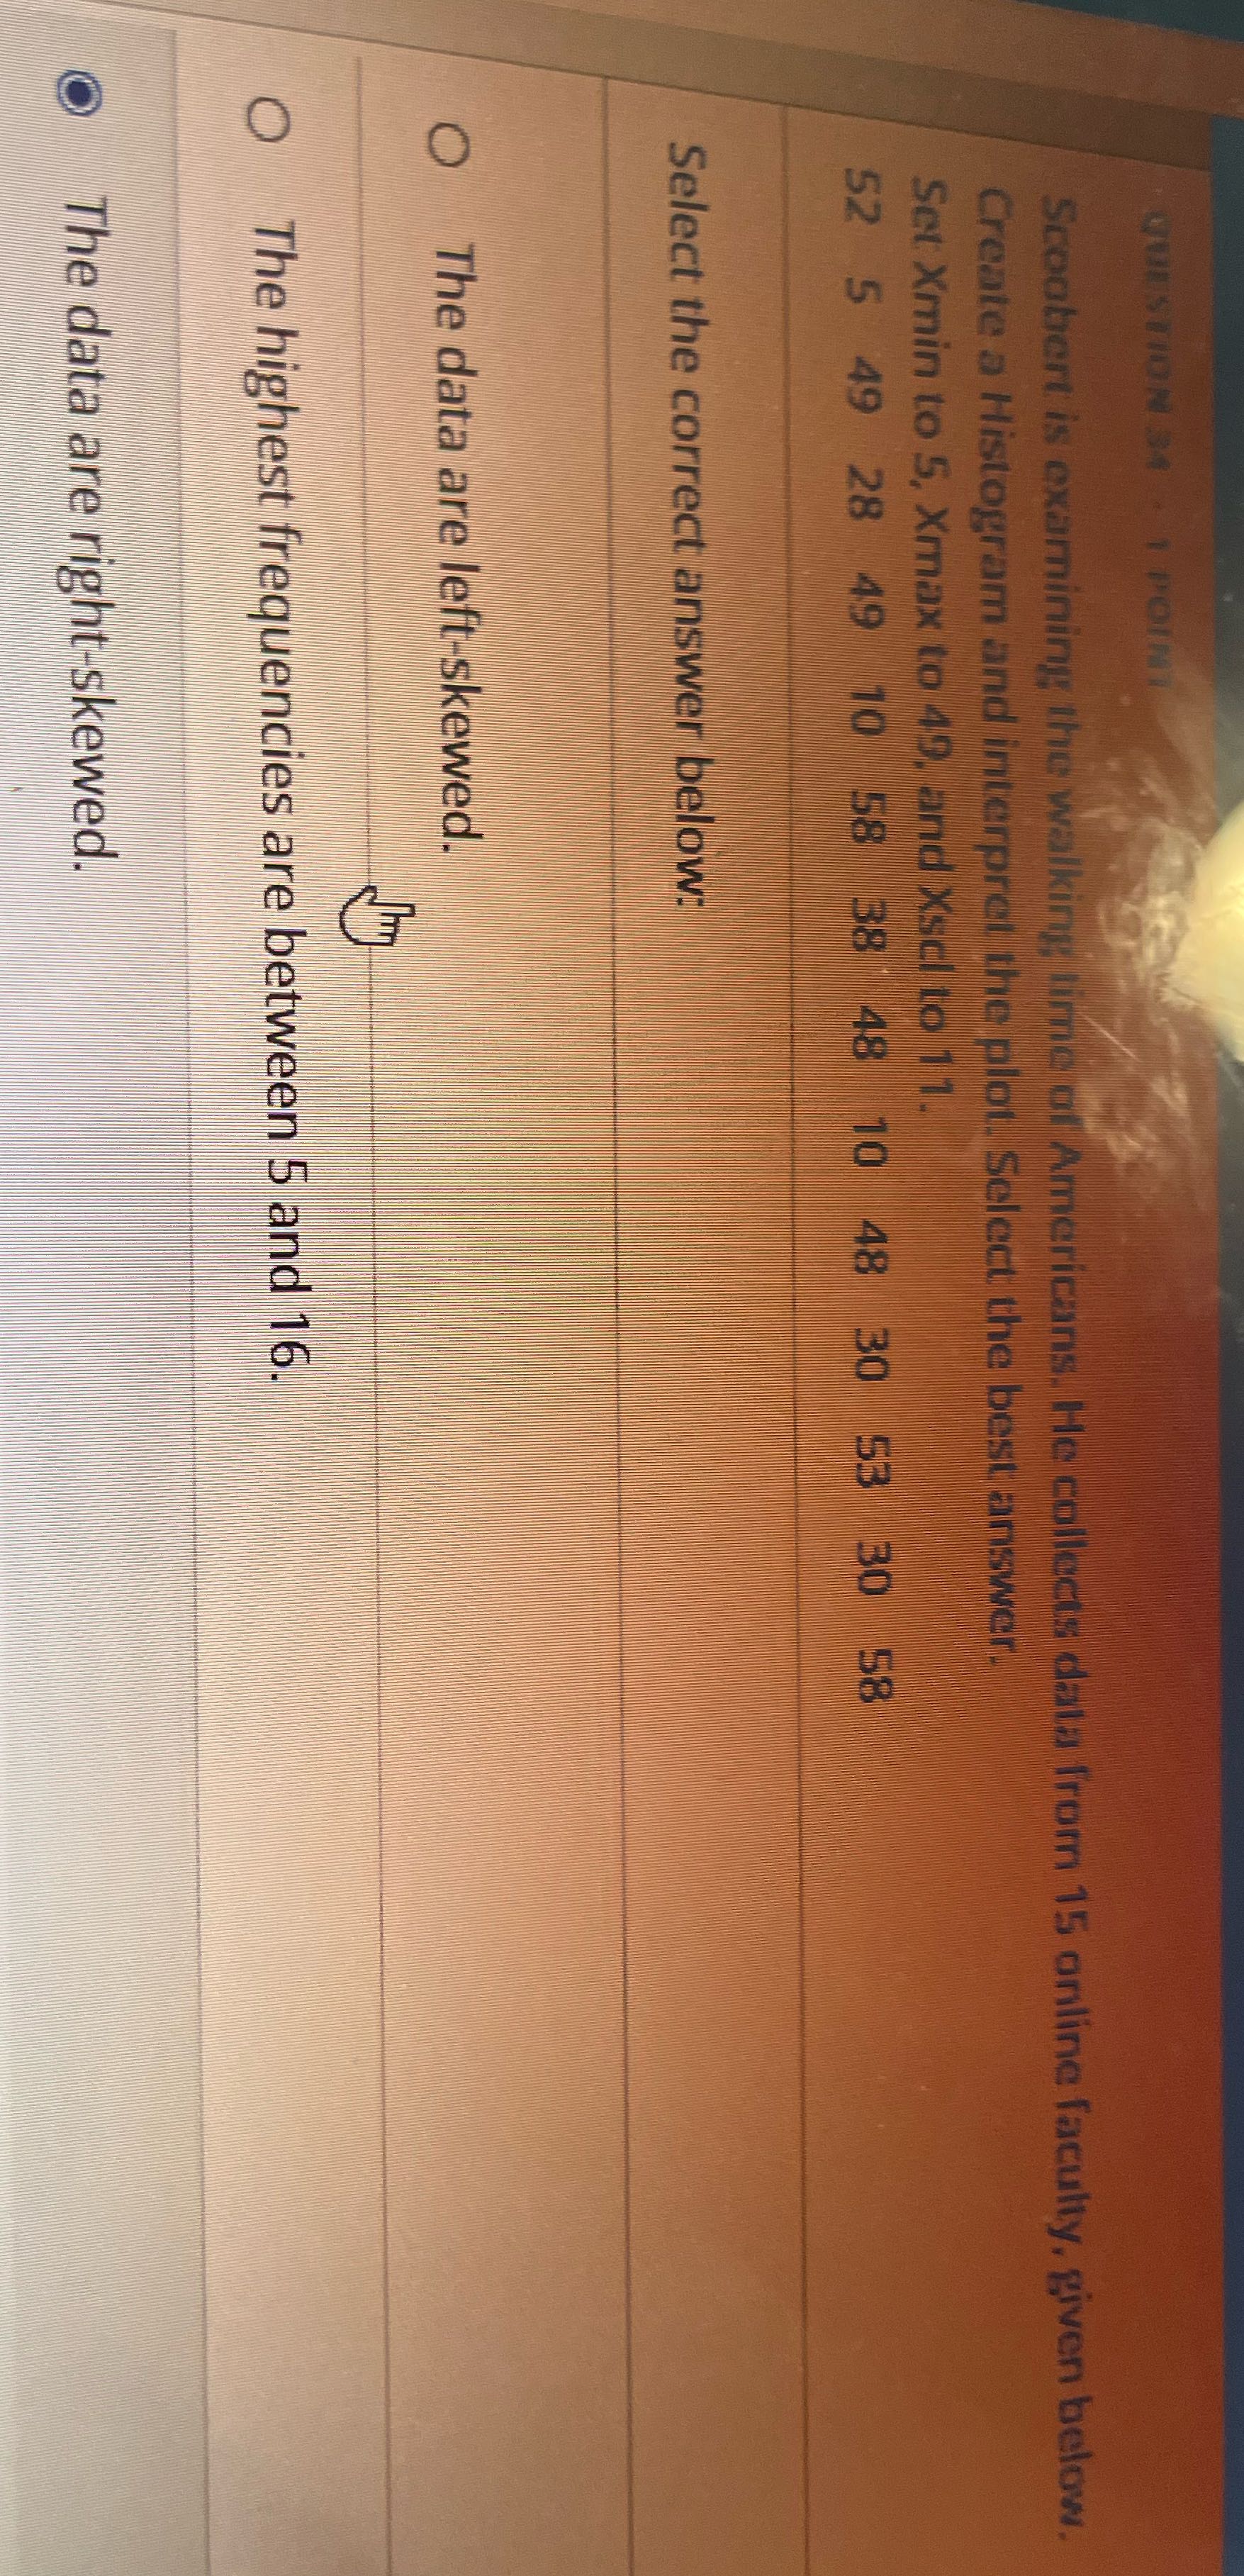
Question: QUESTION 34 . 1 POINT Scoobert is examining the walking time of Americans. He collects data from 15 online faculty, given below. Create a Histogram

QUESTION 34 . 1 POINT Scoobert is examining the
QUESTION 34 . 1 POINT Scoobert is examining the walking time of Americans. He collects data from 15 online faculty, given below. Create a Histogram and interpret the plot. Select the best answer. Set Xmin to 5, Xmax to 43, and Xscl to 1 1. 52 5 49 28 49 10 58 38 48 10 48 30 53 30 58 Select the correct answer below: O The data are left-skewed. E The highest frequencies are between 5 and 16. The data are right-skewed

Step by Step Solution

There are 3 Steps involved in it

1 Expert Approved Answer
Step: 1 Unlock blur-text-image
Question Has Been Solved by an Expert!

Get step-by-step solutions from verified subject matter experts

Step: 2 Unlock
Step: 3 Unlock

Students Have Also Explored These Related Accounting Questions!