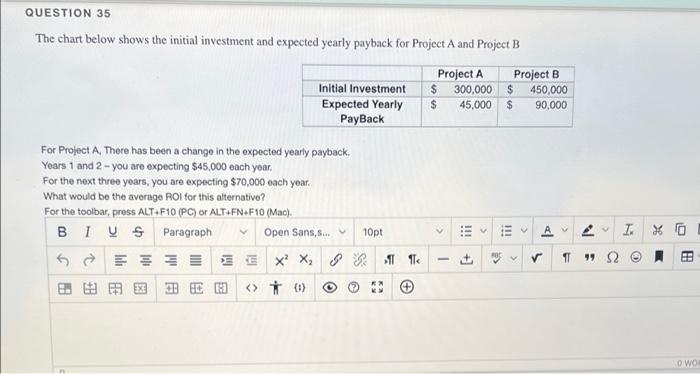
Question: QUESTION 35 The chart below shows the initial investment and expected yearly payback for Project A and Project B Project A Project B Initial Investment

QUESTION 35 The chart below shows the initial
QUESTION 35 The chart below shows the initial investment and expected yearly payback for Project A and Project B Project A Project B Initial Investment $ 300,000 $450,000 Expected Yearly $ 45,000 $ 90,000 PayBack For Project A, There has been a change in the expected yearly payback. Years 1 and 2 - you are expecting $45,000 each year. For the next three years, you are expecting $70,000 each your What would be the average Rol for this alternativo? For the toolbar, press ALT+F10 (PC) or ALT+FN+F10 (Mac). BIVS Paragraph Open Sans, s... 10pt 5x X, 11 > ) V iii A 2 TXO +] TT 99 2 e KA O WO

Step by Step Solution

There are 3 Steps involved in it

1 Expert Approved Answer
Step: 1 Unlock blur-text-image
Question Has Been Solved by an Expert!

Get step-by-step solutions from verified subject matter experts

Step: 2 Unlock
Step: 3 Unlock

Students Have Also Explored These Related General Management Questions!