

Question: (Question 3C) (The following grain yield data came from an experiment on three rice varieties (VI, V2 & V3) with four replications (RI, R2, R3
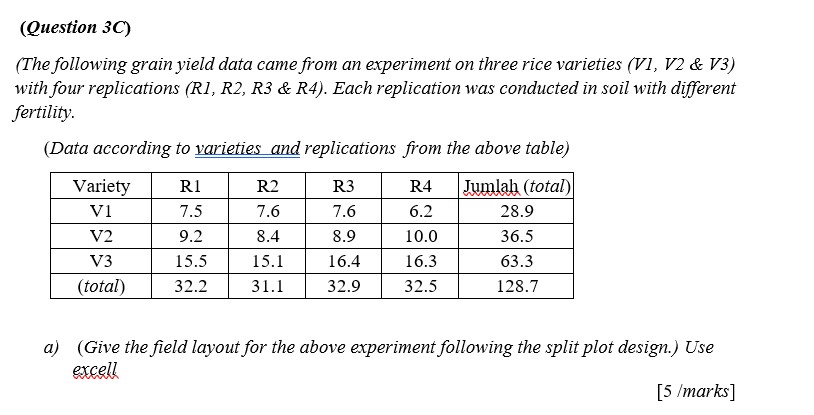
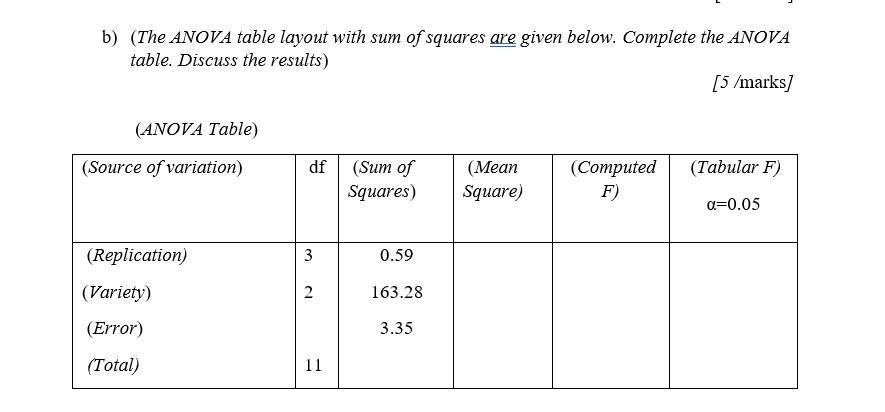
(Question 3C) (The following grain yield data came from an experiment on three rice varieties (VI, V2 & V3) with four replications (RI, R2, R3 & R4). Each replication was conducted in soil with different fertility. (Data according to varieties and replications from the above table) Variety R1 R2 R3 R4 Jumlah (total) V1 7.5 7.6 7.6 6.2 28.9 V2 9.2 8.4 8.9 10.0 36.5 V3 15.5 15.1 16.4 16.3 63.3 (total) 32.2 31.1 32.9 32.5 128.7 a) (Give the field layout for the above experiment following the split plot design.) Use exc [5 /marks]b) (The ANOVA table layout with sum of squares are given below. Complete the ANOVA table. Discuss the results) [5 /marks] (ANOVA Table) (Source of variation) df (Sum of (Mean (Computed (Tabular F) Squares) Square) F 0=0.05 (Replication) 3 0.59 (Variety) 2 163.28 (Error) 3.35 (Total) 11
Step by Step Solution
There are 3 Steps involved in it

Get step-by-step solutions from verified subject matter experts