

Question: Question 3Show the work please! 3. From a survey, it was found 38.6% of students taking a first-year statistics class have high math anxiety. Let
Question 3Show the work please!
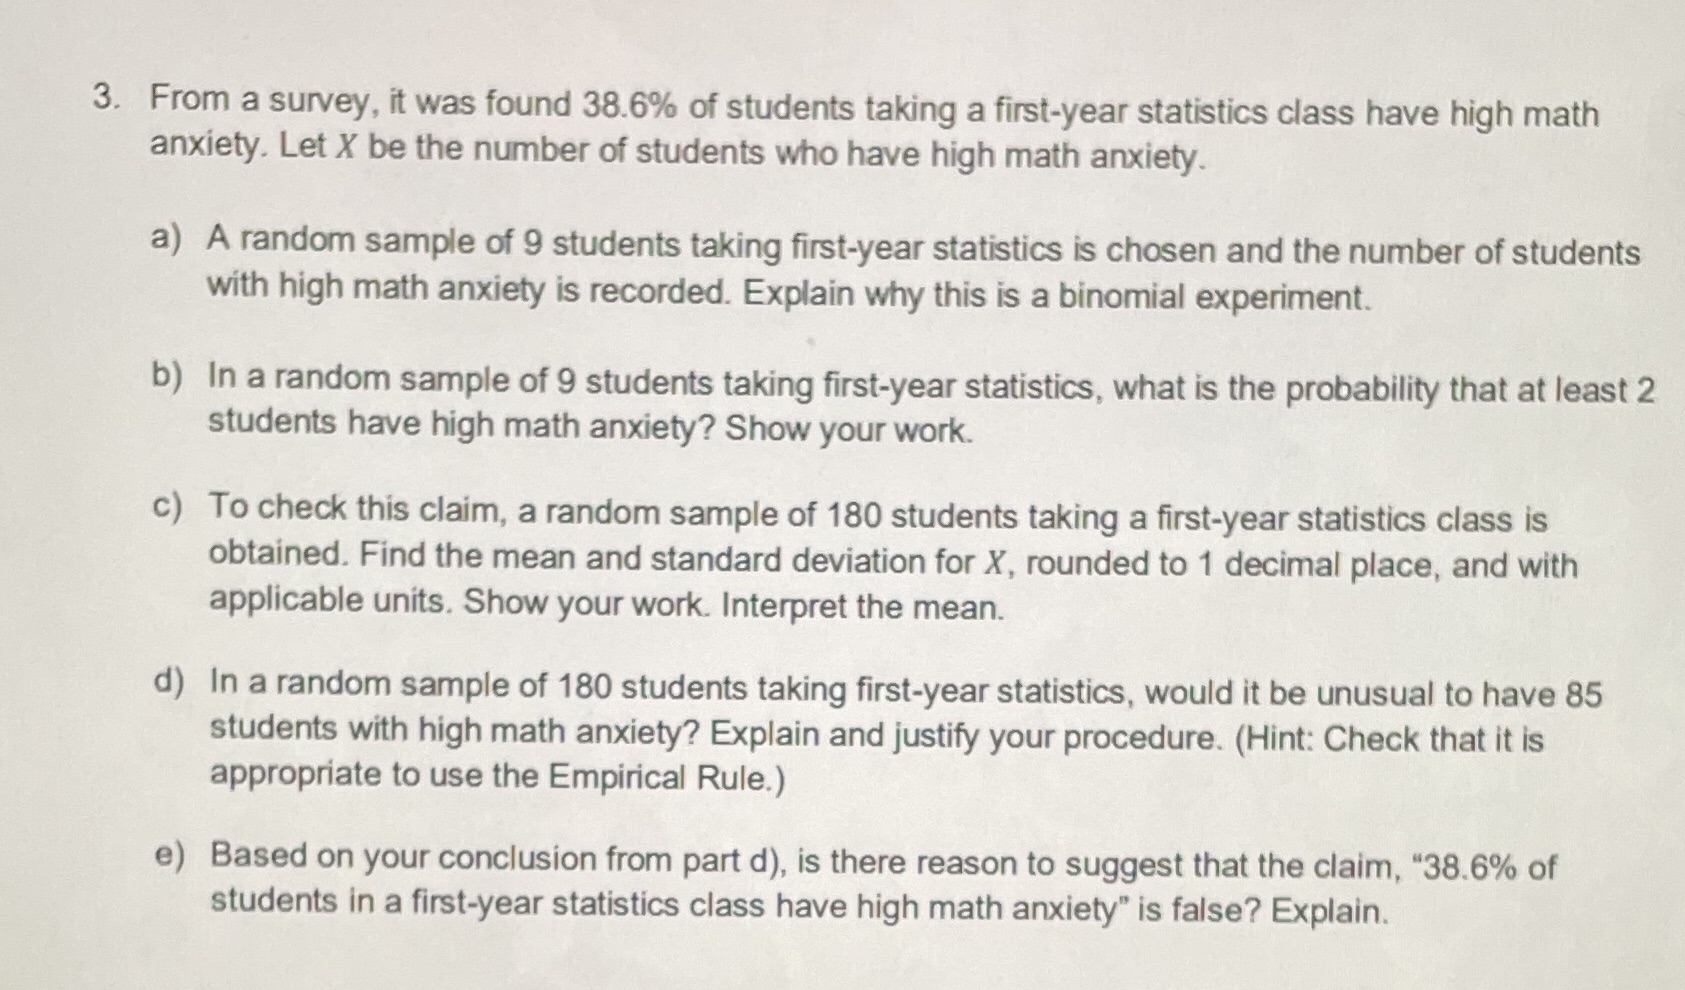
3. From a survey, it was found 38.6% of students taking a first-year statistics class have high math anxiety. Let X be the number of students who have high math anxiety. a) A random sample of 9 students taking first-year statistics is chosen and the number of students with high math anxiety is recorded. Explain why this is a binomial experiment. b) In a random sample of 9 students taking first-year statistics, what is the probability that at least 2 students have high math anxiety? Show your work. c) To check this claim, a random sample of 180 students taking a first-year statistics class is obtained. Find the mean and standard deviation for X, rounded to 1 decimal place, and with applicable units. Show your work. Interpret the mean. d) In a random sample of 180 students taking first-year statistics, would it be unusual to have 85 students with high math anxiety? Explain and justify your procedure. (Hint: Check that it is appropriate to use the Empirical Rule.) e) Based on your conclusion from part d), is there reason to suggest that the claim, "38.6% of students in a first-year statistics class have high math anxiety" is false? Explain
Step by Step Solution
There are 3 Steps involved in it

Get step-by-step solutions from verified subject matter experts