

Question: Question 4 1 pts Why does the plot produced by the following code show only 4 points, given that there are 5 people in the
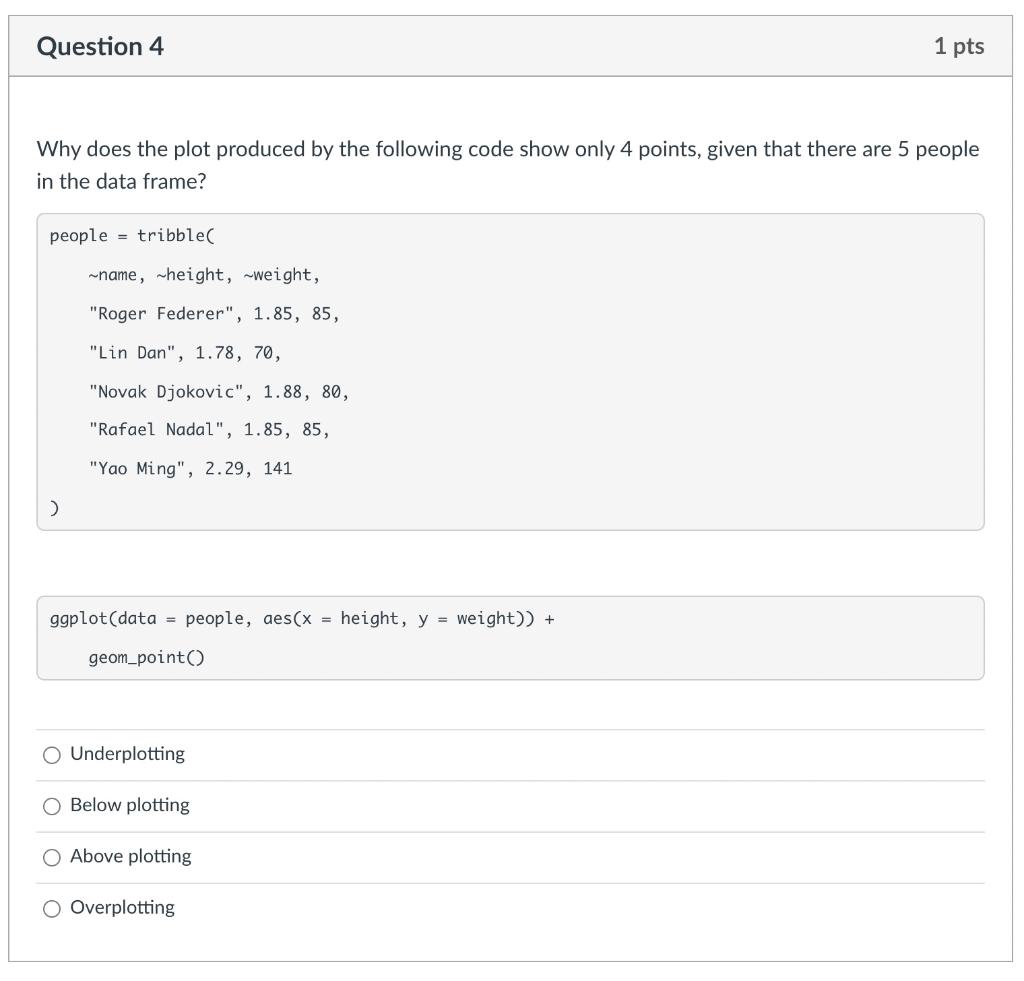
Question 4 1 pts Why does the plot produced by the following code show only 4 points, given that there are 5 people in the data frame? people = tribble name, -height, -weight, "Roger Federer", 1.85, 85, "Lin Dan", 1.78, 70, "Novak Djokovic", 1.88, 80, "Rafael Nadal", 1.85, 85, "Yao Ming", 2.29, 141 D ggplot(data = people, aes(x = height, y = weight)) + geom_point O Underplotting Below plotting O Above plotting O Overplotting
Step by Step Solution
There are 3 Steps involved in it
1 Expert Approved Answer
Step: 1 Unlock

Question Has Been Solved by an Expert!
Get step-by-step solutions from verified subject matter experts
Step: 2 Unlock
Step: 3 Unlock