

Question: Question 4 - 10 marks The results for the elite class of competitors have been extracted from the file winter.mwx and saved in a new
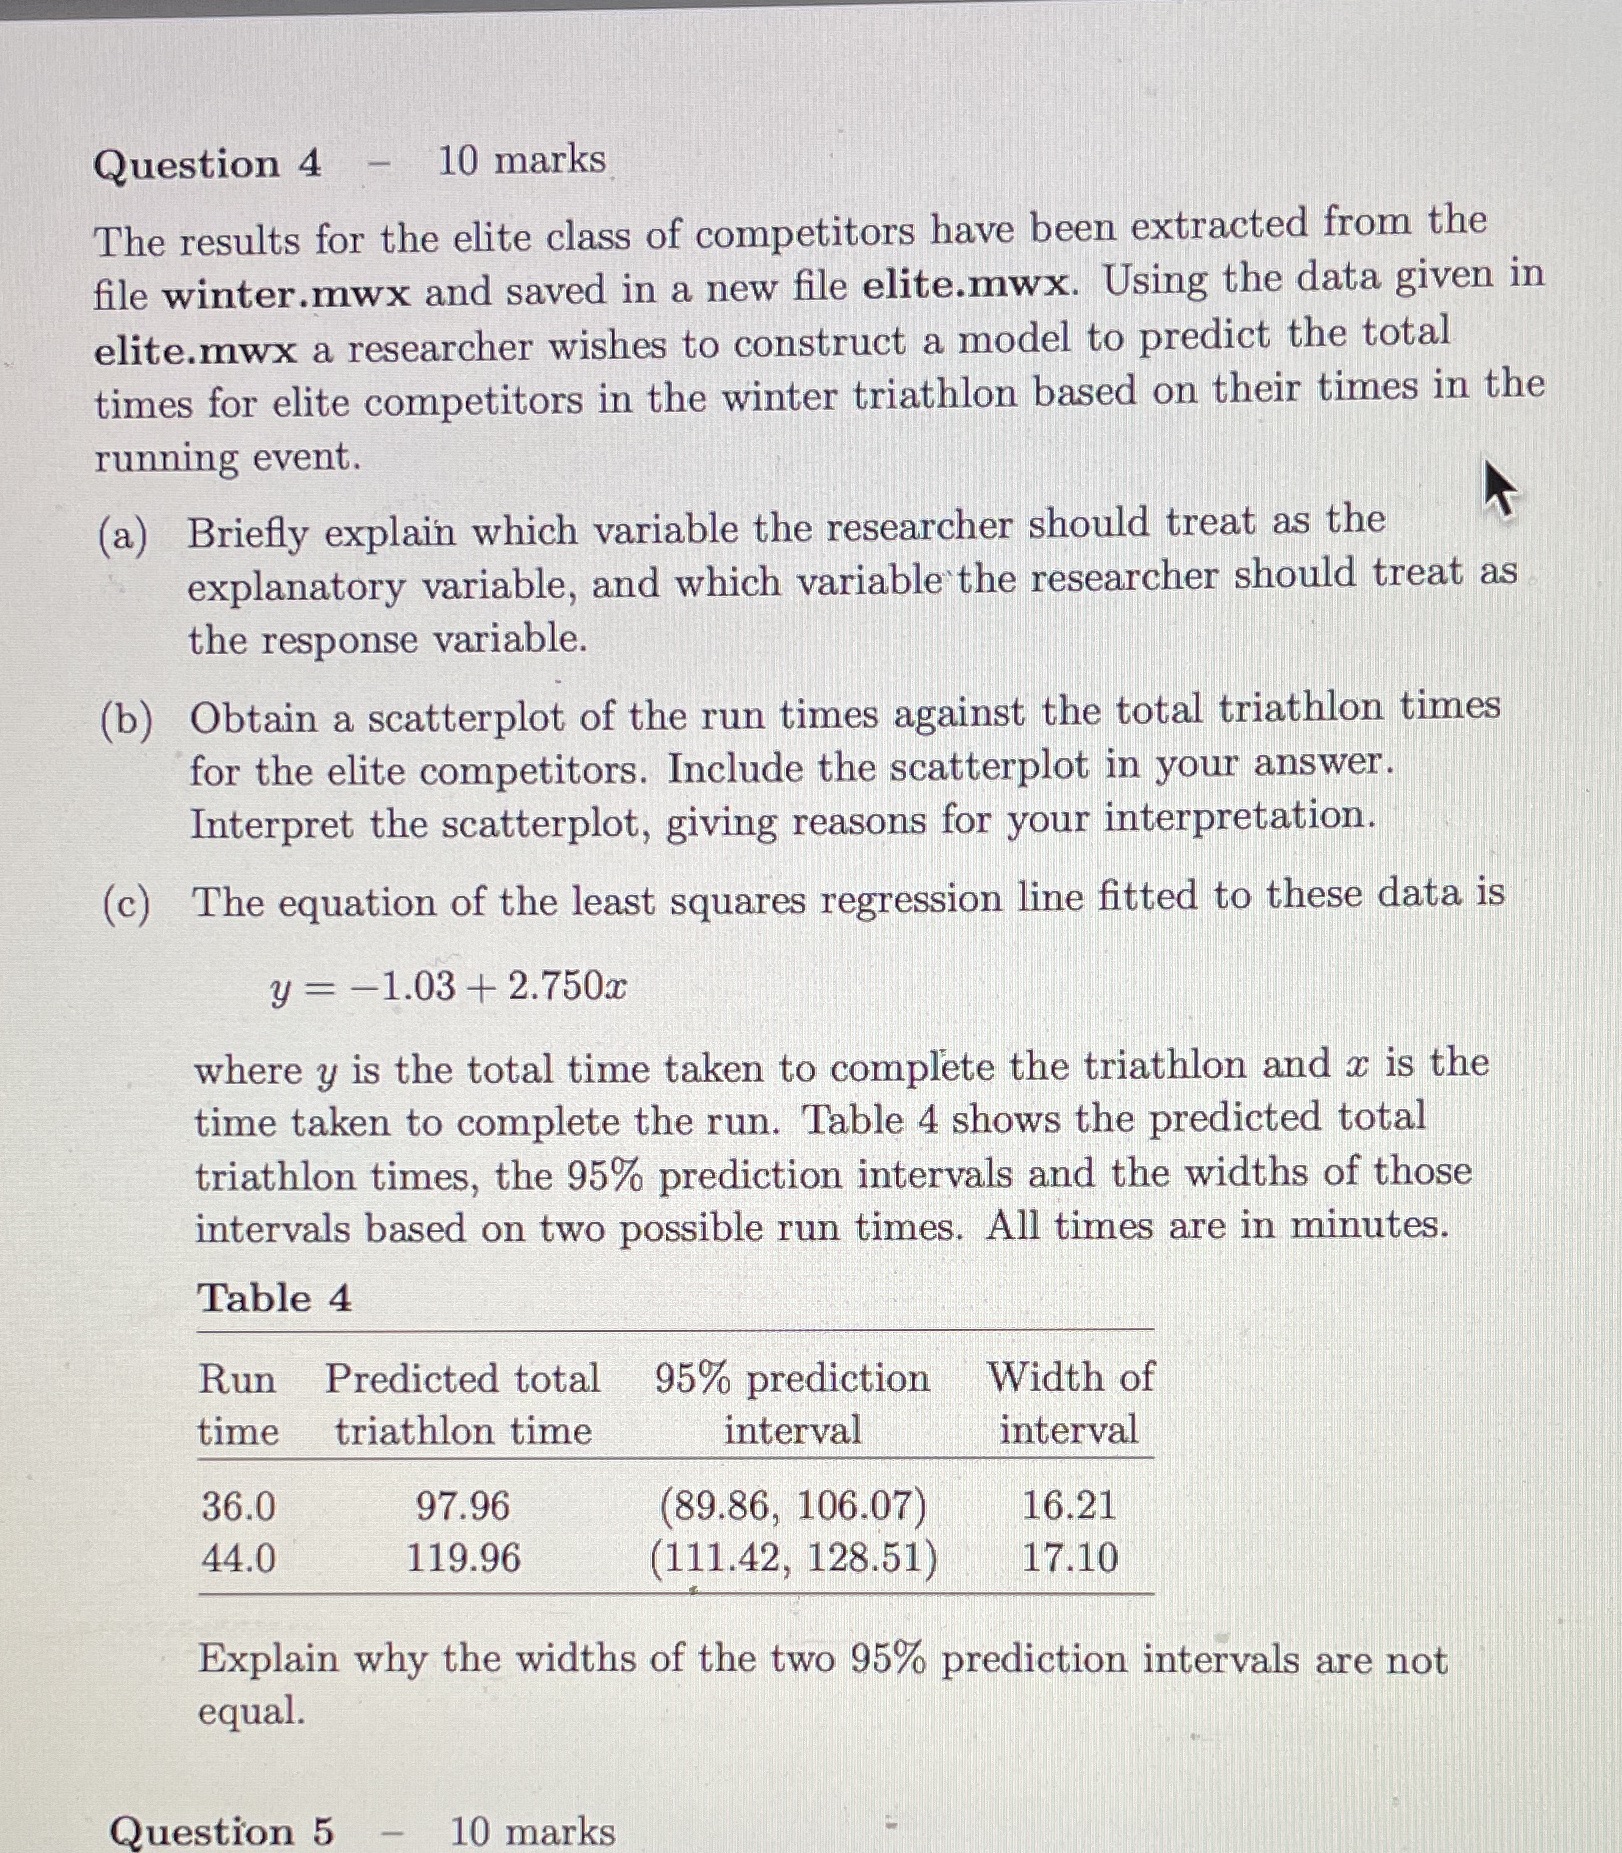
Question 4 - 10 marks The results for the elite class of competitors have been extracted from the file winter.mwx and saved in a new file elite.mwx. Using the data given in elite.mwx a researcher wishes to construct a model to predict the total times for elite competitors in the winter triathlon based on their times in the running event. (a) Briefly explain which variable the researcher should treat as the explanatory variable, and which variable the researcher should treat as the response variable. (b) Obtain a scatterplot of the run times against the total triathlon times for the elite competitors. Include the scatterplot in your answer. Interpret the scatterplot, giving reasons for your interpretation. (c) The equation of the least squares regression line fitted to these data is y = -1.03 + 2.750x where y is the total time taken to complete the triathlon and x is the time taken to complete the run. Table 4 shows the predicted total triathlon times, the 95% prediction intervals and the widths of those intervals based on two possible run times. All times are in minutes. Table 4 Run Predicted total 95% prediction Width of time triathlon time interval interval 36.0 97.96 (89.86, 106.07) 16.21 44.0 119.96 (111.42, 128.51) 17.10 Explain why the widths of the two 95% prediction intervals are not equal. Question 5 - 10 marks
Step by Step Solution
There are 3 Steps involved in it

Get step-by-step solutions from verified subject matter experts