

Question: Question 4 (15 marks) Part A (7 marks) With respect to Appendix 6 & 7 provided and from the review of the Fast Air case
Question 4 (15 marks)
Part A (7 marks)
With respect to Appendix 6 & 7 provided and from the review of the Fast Air case study in the week 12 workshop this semester, answer the following questions:
a) In Appendix 6, the parents share of the profit and equity are the same, i.e. $41,100 and $168,600 for all investment opitons. However, as indicated in Appendix 7, there is the difference in the Return on Asset and Debt ratio between the three investment structures. Provide a critical analysis as to why and how the differences arise. (4 marks)
b) Suppose the board of Fast Air decided to proceed with the acquisition of Hydra-Fast as an associate as this investment structure gives the best financial ratios. Assuming the 50/50 agreement with Hydro-Speed cannot be changed, how can the board of directors ensure that they can structure this investment structure as an associate. (3 marks)
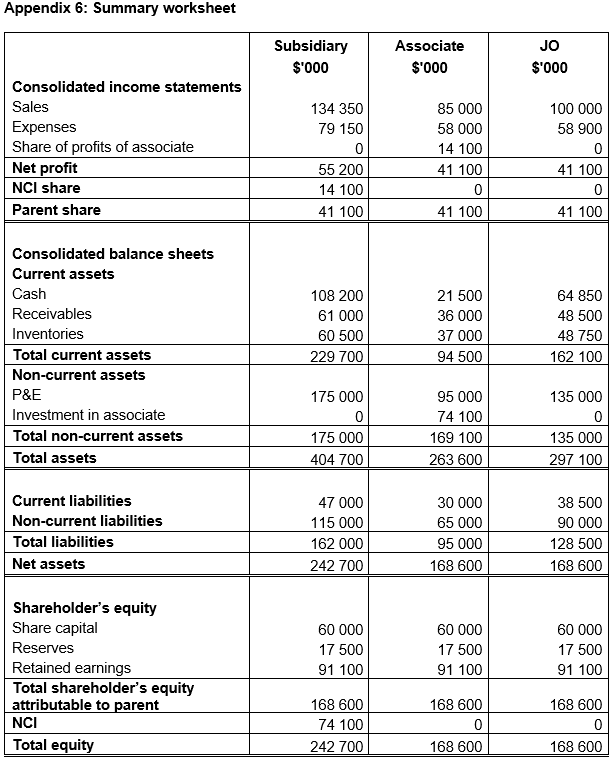
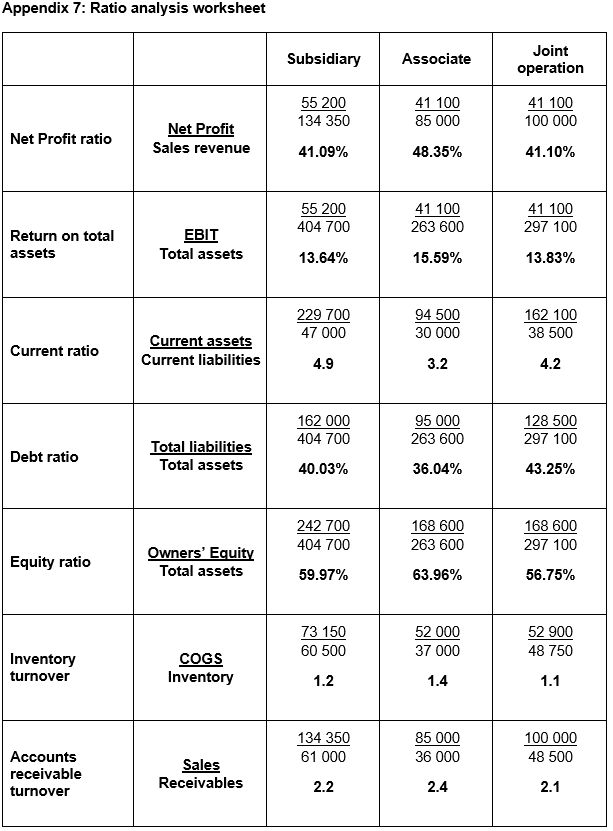
Appendix 6: Summary worksheet Subsidiary $'000 Associate $'000 JO $'000 Consolidated income statements Sales Expenses Share of profits of associate Net profit NCI share Parent share 134 350 79 150 0 55 200 14 100 41 100 85 000 58 000 14 100 41 100 0 41 100 100 000 58 900 0 41 100 0 41 100 Consolidated balance sheets Current assets Cash Receivables Inventories Total current assets Non-current assets P&E Investment in associate Total non-current assets Total assets 108 200 61 000 60 500 229 700 21 500 36 000 37 000 94 500 64 850 48 500 48 750 162 100 175 000 0 175 000 404 700 95 000 74 100 169 100 263 600 135 000 0 135 000 297 100 Current liabilities Non-current liabilities Total liabilities Net assets 47 000 115 000 162 000 242 700 30 000 65 000 95 000 168 600 38 500 90 000 128 500 168 600 60 000 17 500 91 100 Shareholder's equity Share capital Reserves Retained earnings Total shareholder's equity attributable to parent NCI Total equity 60 000 17 500 91 100 60 000 17 500 91 100 168 600 74 100 242 700 168 600 0 168 600 168 600 0 168 600 Appendix 7: Ratio analysis worksheet Subsidiary Associate Joint operation 55 200 134 350 41 100 85 000 41 100 100 000 Net Profit ratio Net Profit Sales revenue 41.09% 48.35% 41.10% 55 200 404 700 41 100 263 600 41 100 297 100 Return on total assets EBIT Total assets 13.64% 15.59% 13.83% 229 700 47 000 94 500 30 000 162 100 38 500 Current ratio Current assets Current liabilities 4.9 3.2 4.2 162 000 404 700 95 000 263 600 128 500 297 100 Debt ratio Total liabilities Total assets 40.03% 36.04% 43.25% 242 700 404 700 168 600 263 600 168 600 297 100 Equity ratio Owners' Equity Total assets 59.97% 63.96% 56.75% 73 150 60 500 52 000 37 000 52 900 48 750 Inventory turnover COGS Inventory 1.2 1.4 1.1 134 350 61 000 85 000 36 000 100 000 48 500 Accounts receivable turnover Sales Receivables 2.2 2.4 2.1 Appendix 6: Summary worksheet Subsidiary $'000 Associate $'000 JO $'000 Consolidated income statements Sales Expenses Share of profits of associate Net profit NCI share Parent share 134 350 79 150 0 55 200 14 100 41 100 85 000 58 000 14 100 41 100 0 41 100 100 000 58 900 0 41 100 0 41 100 Consolidated balance sheets Current assets Cash Receivables Inventories Total current assets Non-current assets P&E Investment in associate Total non-current assets Total assets 108 200 61 000 60 500 229 700 21 500 36 000 37 000 94 500 64 850 48 500 48 750 162 100 175 000 0 175 000 404 700 95 000 74 100 169 100 263 600 135 000 0 135 000 297 100 Current liabilities Non-current liabilities Total liabilities Net assets 47 000 115 000 162 000 242 700 30 000 65 000 95 000 168 600 38 500 90 000 128 500 168 600 60 000 17 500 91 100 Shareholder's equity Share capital Reserves Retained earnings Total shareholder's equity attributable to parent NCI Total equity 60 000 17 500 91 100 60 000 17 500 91 100 168 600 74 100 242 700 168 600 0 168 600 168 600 0 168 600 Appendix 7: Ratio analysis worksheet Subsidiary Associate Joint operation 55 200 134 350 41 100 85 000 41 100 100 000 Net Profit ratio Net Profit Sales revenue 41.09% 48.35% 41.10% 55 200 404 700 41 100 263 600 41 100 297 100 Return on total assets EBIT Total assets 13.64% 15.59% 13.83% 229 700 47 000 94 500 30 000 162 100 38 500 Current ratio Current assets Current liabilities 4.9 3.2 4.2 162 000 404 700 95 000 263 600 128 500 297 100 Debt ratio Total liabilities Total assets 40.03% 36.04% 43.25% 242 700 404 700 168 600 263 600 168 600 297 100 Equity ratio Owners' Equity Total assets 59.97% 63.96% 56.75% 73 150 60 500 52 000 37 000 52 900 48 750 Inventory turnover COGS Inventory 1.2 1.4 1.1 134 350 61 000 85 000 36 000 100 000 48 500 Accounts receivable turnover Sales Receivables 2.2 2.4 2.1
Step by Step Solution
There are 3 Steps involved in it

Get step-by-step solutions from verified subject matter experts