

Question: Question 4: (2 points) A survey was conducted to determine how people allocate their free time during a typical week. A total of 240 participants
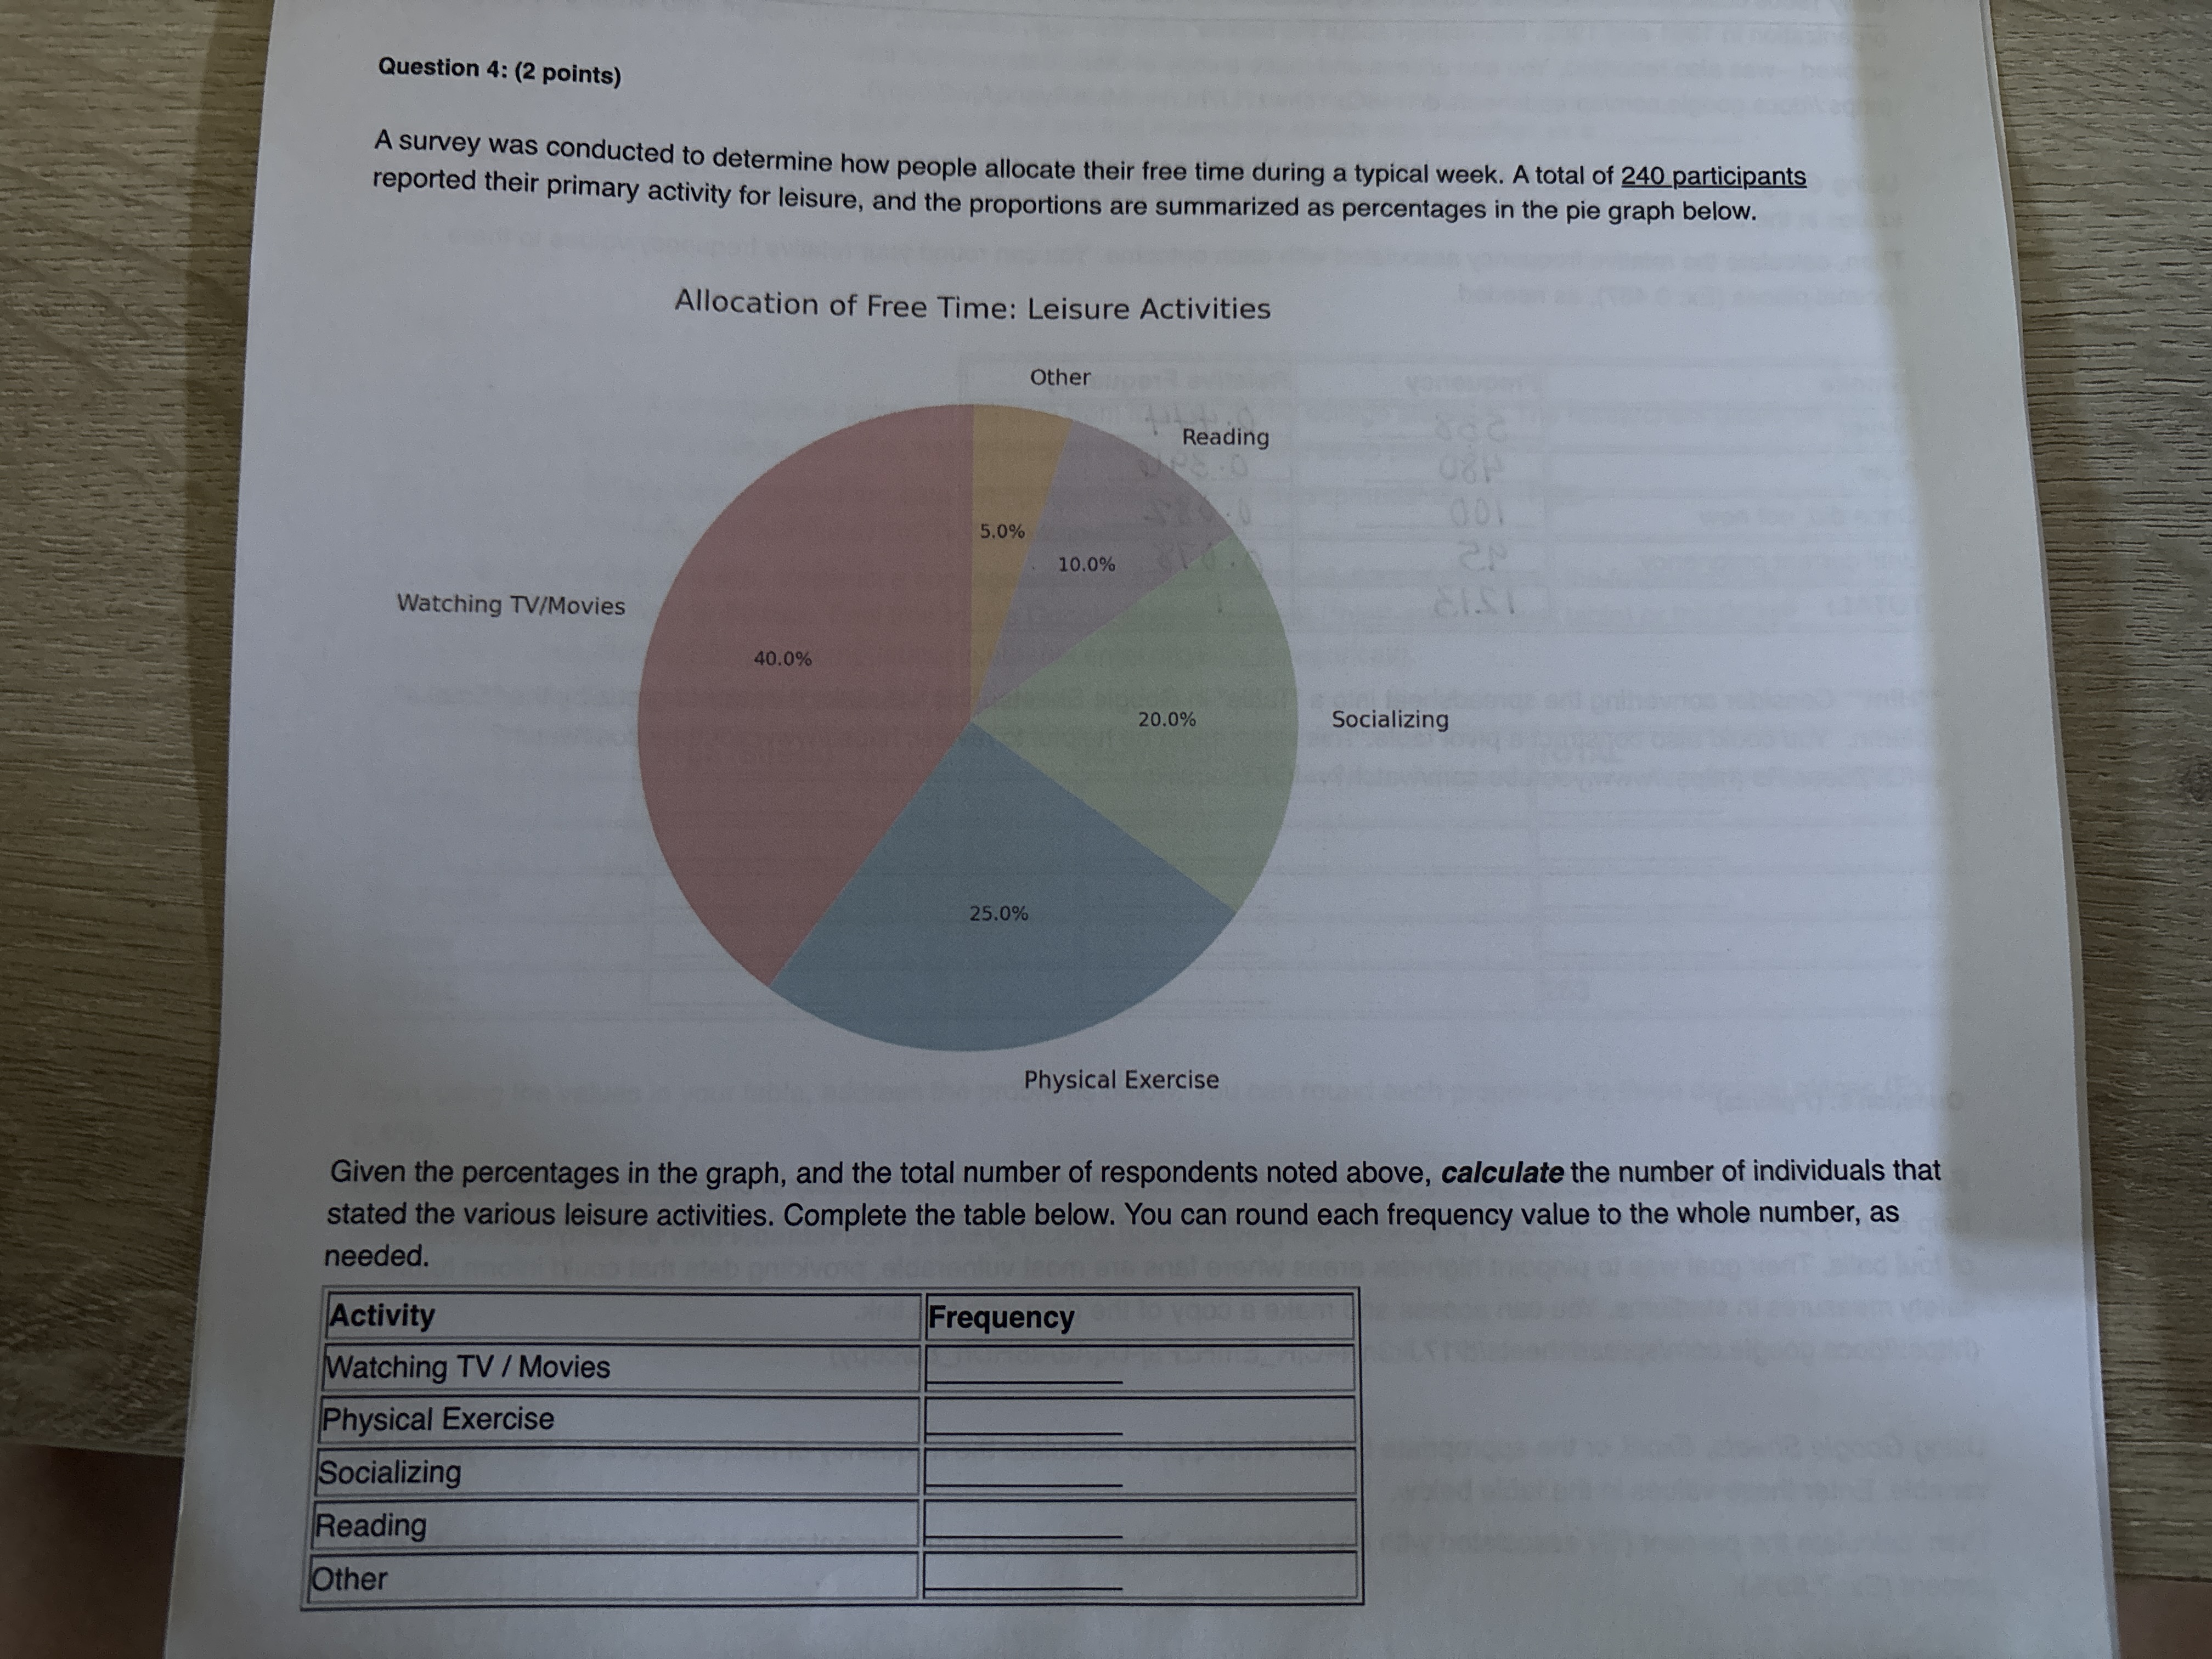 Question 4: (2 points) A survey was conducted to determine how people allocate their free time during a typical week. A total of 240 participants reported their primary activity for leisure, and the proportions are summarized as percentages in the pie graph below. Allocation of Free Time: Leisure Activities Other Reading 5.0% 10.0% Watching TV/Movies 40.0% 20.0% Socializing 25.0% Physical Exercise Given the percentages in the graph, and the total number of respondents noted above, calculate the number of individuals that stated the various leisure activities. Complete the table below. You can round each frequency value to the whole number, as needed. Activity Frequency Watching TV / Movies Physical Exercise Socializing Reading Other
Step by Step Solution
There are 3 Steps involved in it

Get step-by-step solutions from verified subject matter experts