

Question: Question 4 2 pts Which MATLAB code would be used to plot y=cos(x) and y=sin(x) from 0 to 2pi in increments of pi/100, on the
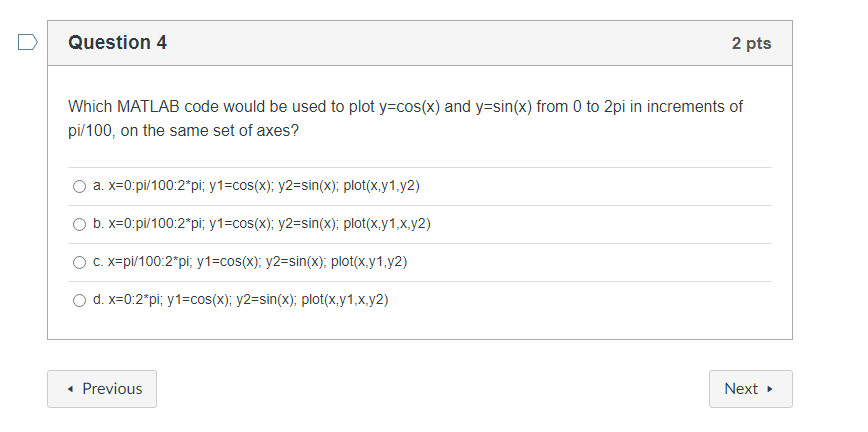

Question 4 2 pts Which MATLAB code would be used to plot y=cos(x) and y=sin(x) from 0 to 2pi in increments of pi/100, on the same set of axes? a. x=0:pi/100:2*pi; y1=cos(x); y2=sin(x); plot(x,y1,y2) b. x=0:pi/100:2*pi; y1=cos(x); y2=sin(x); plot(x,y1,x,y2) C. x=pi/100:2*pi; y1=cos(x); y2=sin(x), plot(x,y1, y2) O d. x=0:2*pi; y1=cos(x): y2=sin(x); plot(x,y1,x,y2) Previous Next Question 5 2 pts What would be the results of the following code? x=0:1:10; y=x.^2-10*x+15; plot(x,y, 'r-- ,x,y,'bo'); A plot of y=x^2-10x+15 where the line is solid blue with red circle markers and the x axis goes from 0 to 10 in increments of 1. A plot of y=x^2-10x+15 where the line is red dashed with blue circle markers and the x axis goes from 1 to 10. A plot of y=x^2-10x+15 where the line is blue dashed with red circle markers and the x axis goes from 0 to 10 in increments of 1. A plot of y=x^2-10x+15 where the line is red dashed with blue circle markers and the x axis goes from 0 10 in increments of 1.
Step by Step Solution
There are 3 Steps involved in it
Lets address each question step by step Question 4 We need MATLAB code to plot y cosx and y ... View full answer

Get step-by-step solutions from verified subject matter experts