

Question: Question #4 (20 Marks) Table Q4 shows information for systems A and B. By using the information provided determine: Dollar spent Table Q4 Information on
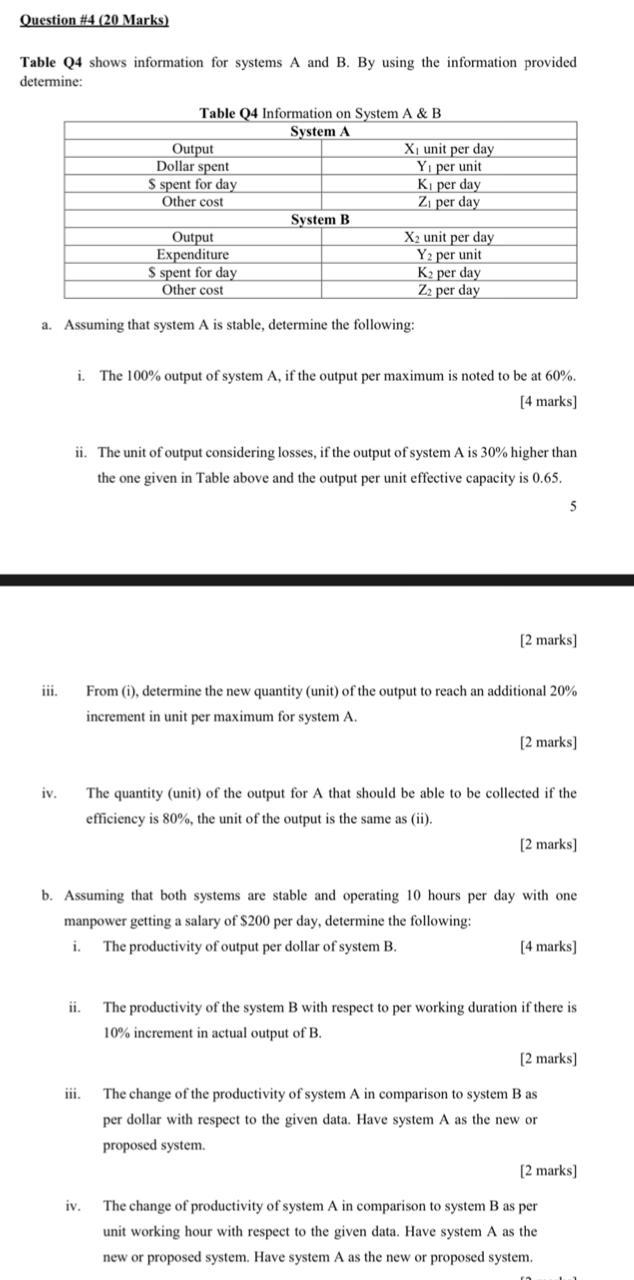
Question #4 (20 Marks) Table Q4 shows information for systems A and B. By using the information provided determine: Dollar spent Table Q4 Information on System A & B System A Output X1 unit per day Y1 per unit S spent for day Ki per day Other cost Z per day System B Output X2 unit per day Expenditure Y2 per unit S spent for day K per day Other cost Z2 per day a. Assuming that system A is stable, determine the following: i. The 100% output of system A, if the output per maximum is noted to be at 60%. [4 marks) ii. The unit of output considering losses, if the output of system A is 30% higher than the one given in Table above and the output per unit effective capacity is 0.65. [2 marks] iii. From (i), determine the new quantity (unit) of the output to reach an additional 20% increment in unit per maximum for system A. [2 marks] iv. The quantity (unit) of the output for A that should be able to be collected if the efficiency is 80%, the unit of the output is the same as (ii). [2 marks] b. Assuming that both systems are stable and operating 10 hours per day with one manpower getting a salary of $200 per day, determine the following: The productivity of output per dollar of system B. [4 marks) i ii. The productivity of the system B with respect to per working duration if there is 10% increment in actual output of B. [2 marks] The change of the productivity of system A in comparison to system B as per dollar with respect to the given data. Have system A as the new or proposed system [2 marks] iv. The change of productivity of system A in comparison to system B as per unit working hour with respect to the given data. Have system A as the new or proposed system. Have system A as the new or proposed system
Step by Step Solution
There are 3 Steps involved in it

Get step-by-step solutions from verified subject matter experts