

Question: Question 4 (25 marks) Appendices I to Ill contain a Balance Sheet and Statement of Income for the New Zealand Company Kathmandu Holdings Limited and
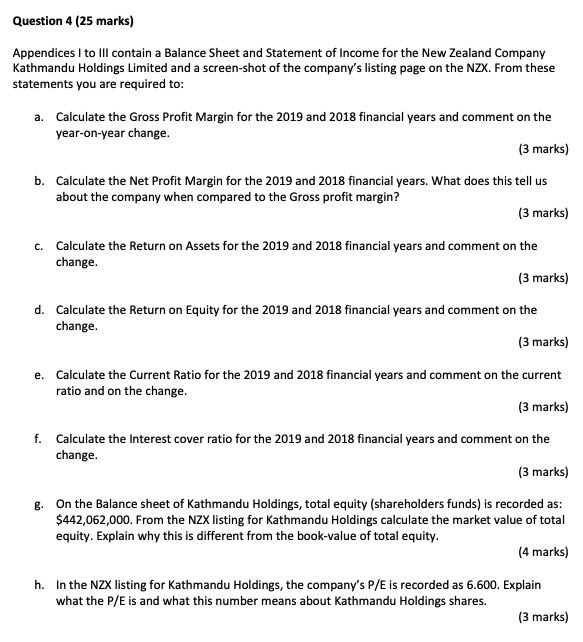
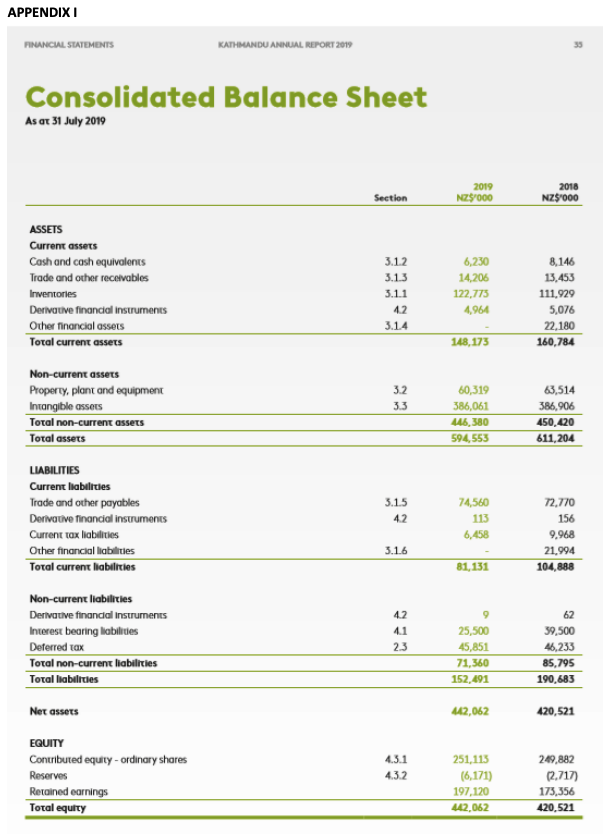
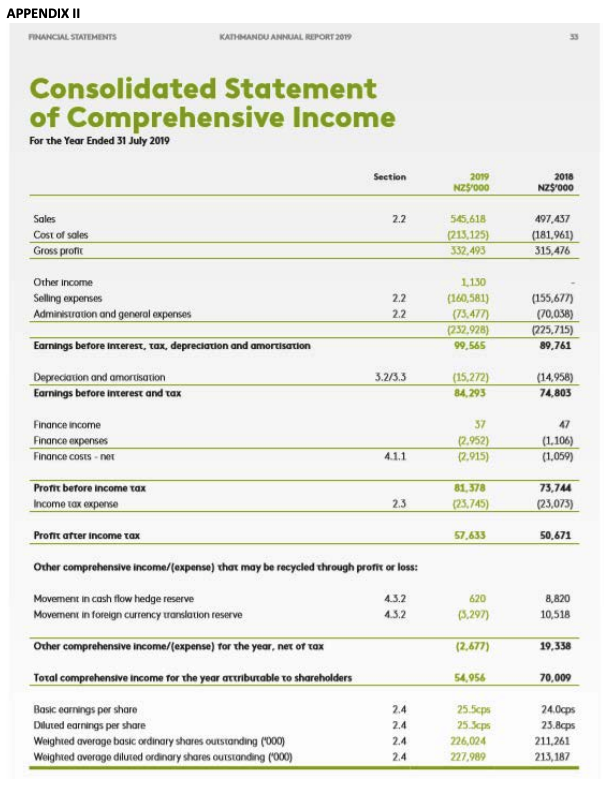
Question 4 (25 marks) Appendices I to Ill contain a Balance Sheet and Statement of Income for the New Zealand Company Kathmandu Holdings Limited and a screen-shot of the company's listing page on the NZX. From these statements you are required to: a. Calculate the Gross Profit Margin for the 2019 and 2018 financial years and comment on the year-on-year change. (3 marks) b. Calculate the Net Profit Margin for the 2019 and 2018 financial years. What does this tell us about the company when compared to the Gross profit margin? (3 marks) c. Calculate the Return on Assets for the 2019 and 2018 financial years and comment on the change (3 marks) d. Calculate the Return on Equity for the 2019 and 2018 financial years and comment on the change. (3 marks) e. Calculate the Current Ratio for the 2019 and 2018 financial years and comment on the current ratio and on the change. (3 marks) f. Calculate the Interest cover ratio for the 2019 and 2018 financial years and comment on the change. (3 marks) g. On the Balance sheet of Kathmandu Holdings, total equity (shareholders funds) is recorded as: $442,062,000. From the NZX listing for Kathmandu Holdings calculate the market value of total equity. Explain why this is different from the book-value of total equity. (4 marks) h. In the NZX listing for Kathmandu Holdings, the company's P/E is recorded as 6.600. Explain what the P/E is and what this number means about Kathmandu Holdings shares. (3 marks) APPENDIX I PINANCUL STATEMENTS KATHMANDU ANNUAL REPORT 2019 Consolidated Balance Sheet As at 31 July 2019 2019 NZ$000 2018 NZ$ 000 Section ASSETS Current assets Cash and cash equivalents Trade and other recevables Inventories Derivative financial instruments Other financial assets Total current assets 3.12 3.13 3.1.1 4.2 3.14 6,230 14,206 122,773 4,964 8,146 13,453 111.929 5,076 22,180 160,784 148,173 Non-current assets Property, plant and equipment Intangible assets Total non-current assets Total assets 3.2 3.3 60,319 386,061 446,380 594,553 63,514 386,906 450,420 611,204 LIABILITIES Current liabilities Trade and other payables Derivative financial instruments Current tax liabilities Other financial liabilities Total current liabilities 3.15 42 74,560 113 6,458 72.770 156 9,968 21.994 104,888 3.1.6 81, 131 Non-current liabilities Derivative financial Instruments Interest bearing liabilities Deferred tax Total non-current liabilities Total liabilities 4.2 4.1 23 9 25,500 45,851 71,360 152,491 62 39,500 46,233 85,795 190,683 Net assets 442,062 420,521 EQUITY Contributed equity - ordinary shares Reserves Retained earnings Total equity 4.3.1 4.3.2 251,113 (6,171) 197.120 442.062 249.882 (2.717) 173,356 420,521 APPENDIX II FINANCIAL STATEMENTS KATHMANDU ANNUAL REPORT 2010 Consolidated Statement of Comprehensive Income For the Year Ended 31 July 2019 Section 2019 NZ5000 2018 NZ$ 000 2.2 Sales Cost of sales Gross profit 545,618 215.125) 332.493 497,437 (181,961) 315,476 Other income Selling expenses Administration and general expenses 2.2 2.2 1.150 (160,581) (73.477) (232.928) 99,565 (155,677) (70,058) (225,715) 89,761 Earnings before interest, tax, depreciation and amortisation 3.2/3,3 Deprecation and amortisation Earnings before interest and tax (15.272) 84.293 (14,958) 74.803 Finance income Finance expenses Finance costs-net 37 (2.952) (2.915) 47 (1.106) (1.059) 4.1.1 81,378 (23.745) 73,744 (23,073) 2.3 57,633 50,671 620 (5,297) 8,820 10,518 Profit before income tax Income tax expense Profit after income tax Other comprehensive Income/(expense) that may be recycled through profit or loss: Movement in cash flow hedge reserve 4.3.2 Movement in foreign currency translation reserve 4.5.2 Other comprehensive income/expense) for the year, net of tax Toral comprehensive Income for the year attributable to shareholders Basic earnings per share Diluted earnings per share Weighted average basic ordinary shares outstanding ('000) Weighted average diluted ordinary shares outstanding ('000) (2.677) 19,338 54,956 70,009 2.4 2.4 2.4 2.4 25.5cps 25. Seps 226,024 227,989 24.0cps 23.8cps 211,261 213, 187 Enter your query LOGIN APPENDIX III NZX NEW ZEALAND'S EXCHANGE TE PAEHOKO O AOTEAROA MARKETS - REGULATION PRODUCTS - SERVICES - INVESTING ABOUT NZX- HOME / MARKETS/KMD Overview Dividends > KMD $1.040 + $0.020 / -1.89% 52 Week Change: 50.531/-34.45% Instrument Name Kathmandu Holdings Limited Ordinary Shares Issued By Kathmandu Holdings Limited ISIN NZKMDE000153 Type Ordinary Shares Company Announcements $1.060 $1.090 6.600 $0.161 Activity Trading status Trades Value Volume Capitalisation (000) Trading 1185 53.492.480.60 3.289,782 Performance Open High Low High Bid Low Offer Fundamental P/E EPS NTA Gross Div Yield Securities Issued $1.040 50.133 $1.040 $1.050 13.6134 709,001,384 5737,361 Last updated 295/2020 5:37 pm
Step by Step Solution
There are 3 Steps involved in it

Get step-by-step solutions from verified subject matter experts