

Question: Question 4: (25 points) Given Table I below: Table 1 25 28 27 34 39 18 Y 23 29 34 25 31 22 1. Find
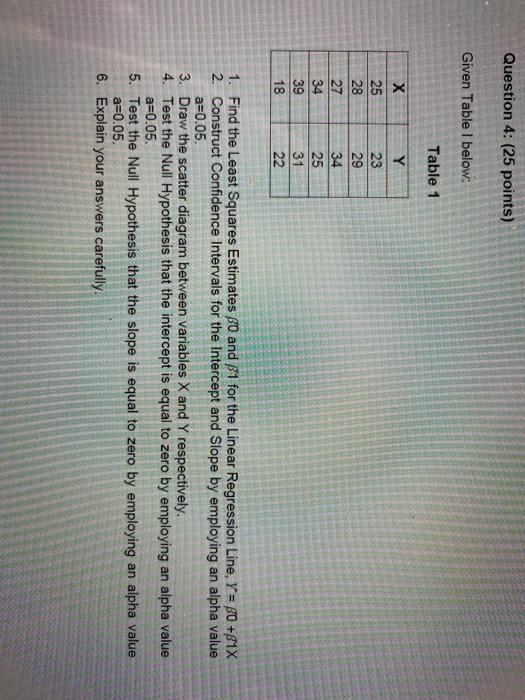
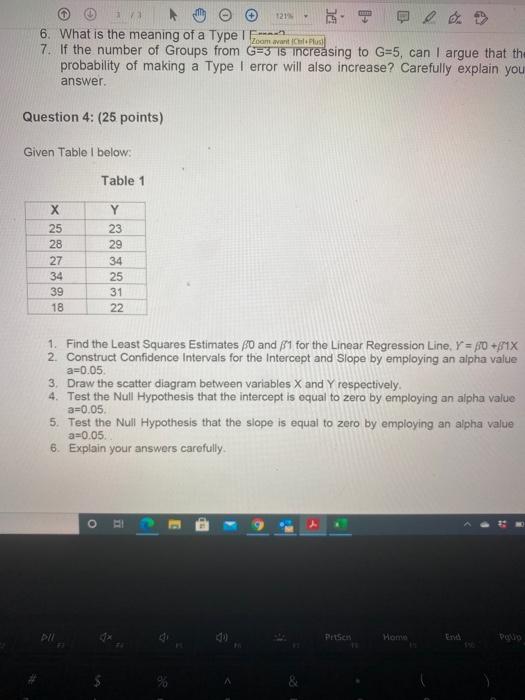
Question 4: (25 points) Given Table I below: Table 1 25 28 27 34 39 18 Y 23 29 34 25 31 22 1. Find the Least Squares Estimates 30 and $1 for the Linear Regression Line, Y = 80 +81X 2. Construct Confidence intervals for the Intercept and Slope by employing an alpha value a=0.05. 3. Draw the scatter diagram between variables X and Y respectively. 4. Test the Null Hypothesis that the intercept is equal to zero by employing an alpha value a=0.05. 5. Test the Null Hypothesis that the slope is equal to zero by employing an alpha value a=0.05. 6. Explain your answers carefully. 1 121 6. What is the meaning of a Type 1 Ecomarca de Plus 7. If the number of Groups from G=3 is increasing to G=5, can I argue that th probability of making a Type I error will also increase? Carefully explain you answer Question 4: (25 points) Given Table I below: Table 1 Y 23 25 28 27 34 39 18 29 34 25 31 22 1. Find the Least Squares Estimates fo and for the Linear Regression Line, Y = 10 +71X 2. Construct Confidence intervals for the Intercept and Slope by employing an alpha value a=0.05. 3. Draw the scatter diagram between variables X and Y respectively 4. Test the Null Hypothesis that the intercept is equal to zero by employing an alpha value a=0.05 5. Test the Null Hypothesis that the slope is equal to zero by employing an alpha value a=0.05 6. Explain your answers carefully PIL Homo Question 4: (25 points) Given Table I below: Table 1 25 28 27 34 39 18 Y 23 29 34 25 31 22 1. Find the Least Squares Estimates 30 and $1 for the Linear Regression Line, Y = 80 +81X 2. Construct Confidence intervals for the Intercept and Slope by employing an alpha value a=0.05. 3. Draw the scatter diagram between variables X and Y respectively. 4. Test the Null Hypothesis that the intercept is equal to zero by employing an alpha value a=0.05. 5. Test the Null Hypothesis that the slope is equal to zero by employing an alpha value a=0.05. 6. Explain your answers carefully. 1 121 6. What is the meaning of a Type 1 Ecomarca de Plus 7. If the number of Groups from G=3 is increasing to G=5, can I argue that th probability of making a Type I error will also increase? Carefully explain you answer Question 4: (25 points) Given Table I below: Table 1 Y 23 25 28 27 34 39 18 29 34 25 31 22 1. Find the Least Squares Estimates fo and for the Linear Regression Line, Y = 10 +71X 2. Construct Confidence intervals for the Intercept and Slope by employing an alpha value a=0.05. 3. Draw the scatter diagram between variables X and Y respectively 4. Test the Null Hypothesis that the intercept is equal to zero by employing an alpha value a=0.05 5. Test the Null Hypothesis that the slope is equal to zero by employing an alpha value a=0.05 6. Explain your answers carefully PIL Homo
Step by Step Solution
There are 3 Steps involved in it

Get step-by-step solutions from verified subject matter experts