

Question: Question 4 (35 marks) Table 6 shows a multiple linear regression of stress on employee, job, and company characteristics, as well as survey year. The

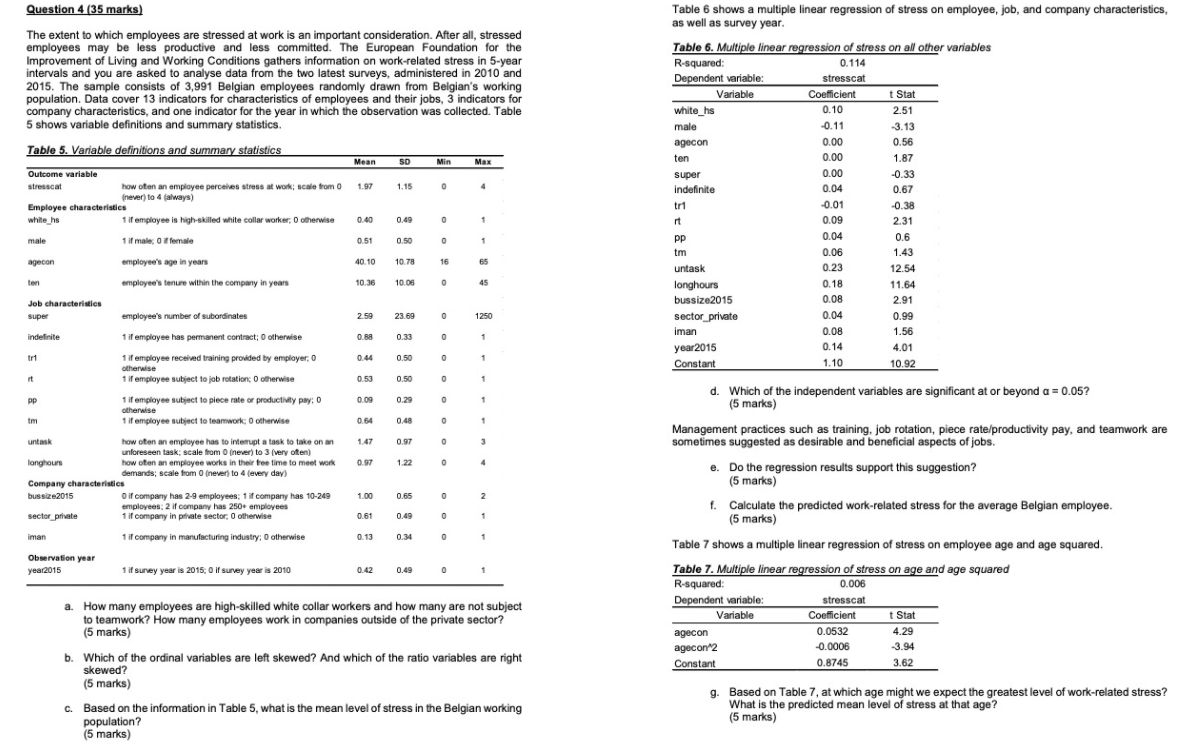
Question 4 (35 marks) Table 6 shows a multiple linear regression of stress on employee, job, and company characteristics, as well as survey year. The extent to which employees are stressed at work is an important consideration. After all, stressed employees may be less productive and less committed. The European Foundation for the Table 6. Multiple linear regression of stress on all other variables Improvement of Living and Working Conditions gathers information on work-related stress in 5-year R-squared: 0.114 intervals and you are asked to analyse data from the two latest surveys, administered in 2010 and Dependent variable: stresscat 2015. The sample consists of 3,991 Belgian employees randomly drawn from Belgian's working population. Data cover 13 indicators for characteristics of employees and their jobs, 3 indicators for Variable Coefficient Stat company characteristics, and one indicator for the year in which the observation was collected. Table white_hs 0.10 2.51 5 shows variable definitions and summary statistics. male -0.11 -3.13 agecon 0.00 0.56 Table 5. Variable definitions and summary statistics Mean SD Min Max ten 0.00 1.87 Outcome variable super 0.00 0.33 stresscat how often an employee perceives stress at work; scale from 0 1.97 1. 15 Indefinite 0.04 0.67 (never) to 4 (always) Employee characteristics tri -0.01 -0.38 while hs 1 if employee is high-skilled white collar worker; 0 otherwise 0.40 0.49 rt 0.09 2.31 male 1 if male: 0 # female 0.51 pp 0.04 0.6 tm 0.06 1.43 agecon employee's age in years 40. 10 10.78 16 untask 0.23 12.54 employee's tenure within the company in years 10.36 10.06 longhours 0.18 11.64 Job characteristics bussize2015 0.08 2.91 super employee's number of subordinates 2.59 23.69 0 1250 sector_private 0.04 0.99 indefinite 1 if employee has permanent contract; 0 otherwise O. RA 1.56 0.33 man 0.08 year2015 D.14 4.01 tri 1 if employee received training provided by employer: 0 0.44 0.50 1.10 otherwise Constant 10.92 rt 1 if employee subject to job rotation; 0 otherwise 0.53 0.50 d. Which of the independent variables are significant at or beyond a = 0.05? pp if employee subject to piece rate or productivity pay; 0 D.09 0.29 otherwise (5 marks) 1 if employee subject to teamwork; O otherwise 0.64 0.48 Management practices such as training, job rotation, piece rate/productivity pay, and teamwork are untank how often an employee has to interrupt a task to take on an 147 0.97 sometimes suggested as desirable and beneficial aspects of jobs. nforeseen task; scale from O (never) to 3 (very often) longhours how often an employee works in their free time to meet work 0.97 1.22 mands; scale from O (never) to 4 (every day) e. Do the regression results support this suggestion? Company characteristics (5 marks) bus size2015 0 if company has 2-9 employees; 1 if company has 10-249 1.00 0.65 employees: 2 if company has 250+ employees f. Calculate the predicted work-related stress for the average Belgian employee. sector_private 1 if company in private sector: 0 otherwise 0.49 0 (5 marks) iman 1 if company in manufacturing industry: 0 otherwise 0.13 0.31 Table 7 shows a multiple linear regression of stress on employee age and age squared. Observation year year2015 1 if survey year is 2015; 0 if survey year is 2010 0.42 0.49 Table 7. Multiple linear regression of stress on age and age squared R-squared: 0.006 a. How many employees are high-skilled white collar workers and how many are not subject Dependent variable: stresscat to teamwork? How many employees work in companies outside of the private sector? Variable Coefficient t Stat 5 marks) agecon 0.0532 4.29 agecon*2 -0.0006 -3.94 . Which of the ordinal variables are left skewed? And which of the ratio variables are right Constant 0.8745 3.62 skewed? (5 marks) g. Based on Table 7, at which age might we expect the greatest level of work-related stress? c. Based on the information in Table 5, what is the mean level of stress in the Belgian working What is the predicted mean level of stress at that age? population? (5 marks) 5 marks)
Step by Step Solution
There are 3 Steps involved in it

Get step-by-step solutions from verified subject matter experts