

Question: Question 4 (4 marks) The chart below represents the production possibilities for a company that produces waders and tablets. a. Create a properly labeled graph
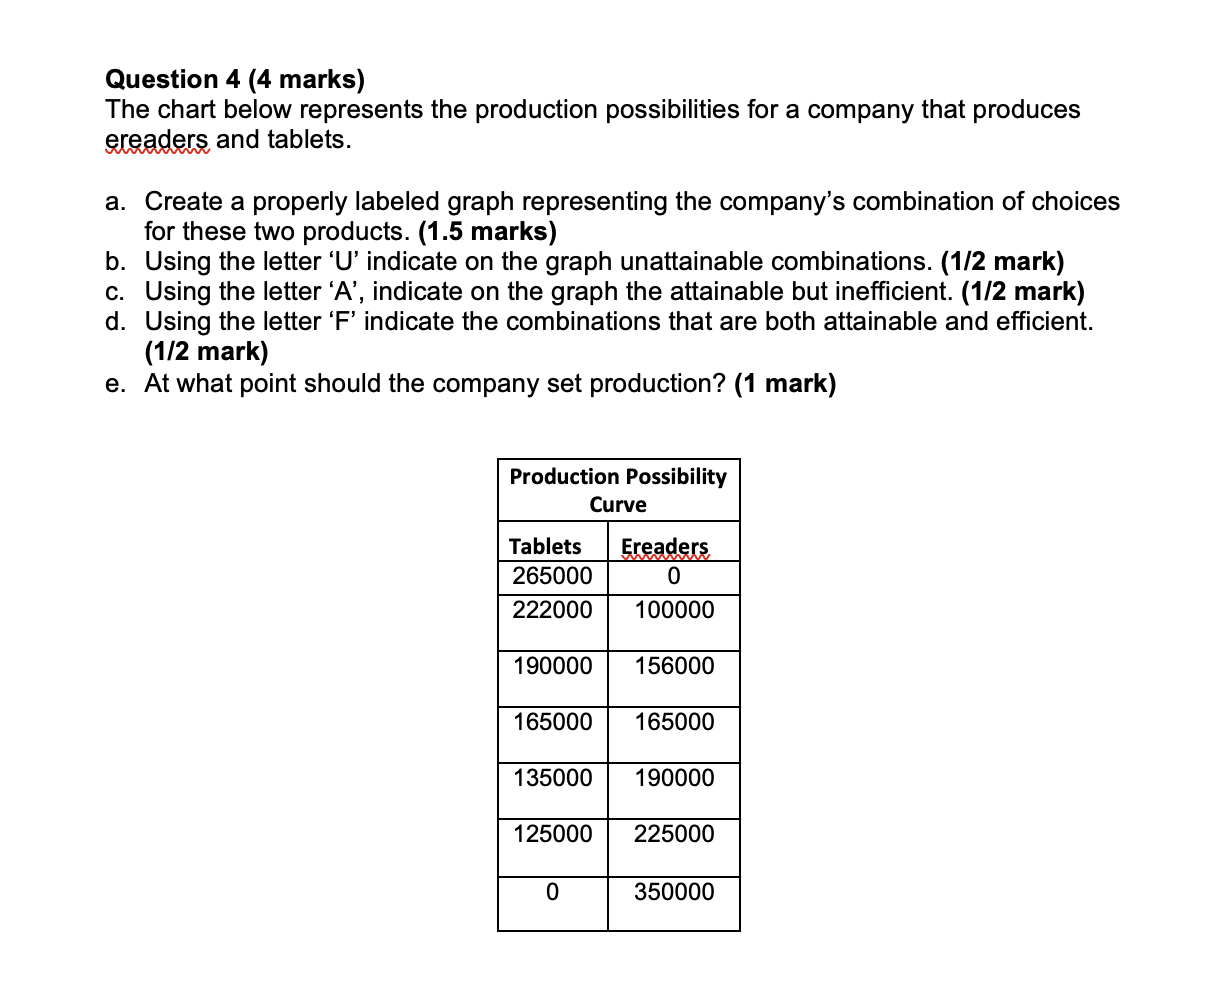
Question 4 (4 marks) The chart below represents the production possibilities for a company that produces waders and tablets. a. Create a properly labeled graph representing the company's combination of choices for these two products. (1.5 marks) b. Using the letter 'U' indicate on the graph unattainable combinations. (11'2 mark) c. Using the letter 'A', indicate on the graph the attainable but inefficient. (112 mark) d. Using the letter 'F' indicate the combinations that are both attainable and efficient. (112 mark) e. At what point should the company set production? (1 mark) Production Possibility Curve 200000 I- 222000 100000 190000 156000 165000 165000 135000 190000 125000 225000
Step by Step Solution
There are 3 Steps involved in it

Get step-by-step solutions from verified subject matter experts