

Question: Question 4: (4 points) A1, B1 & C2 The graph below depicts two different types of costs. Questions related to the graph should be answered
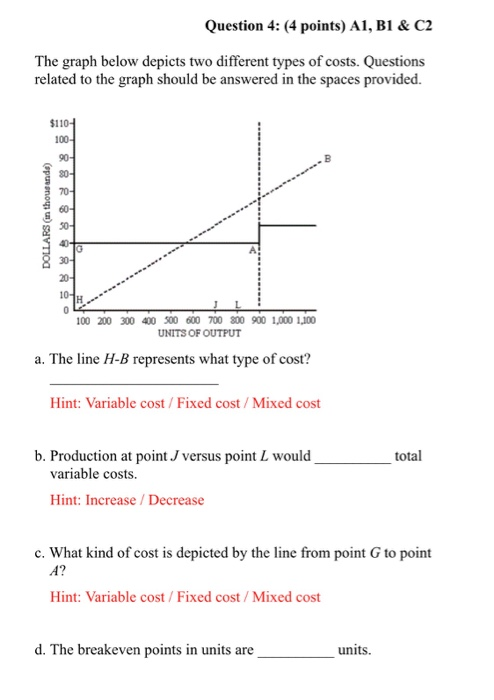
Question 4: (4 points) A1, B1 & C2 The graph below depicts two different types of costs. Questions related to the graph should be answered in the spaces provided. $110-14 100- 90- 80- DOLLARS (in thousands) 70- 60- 50- 4 4070 30- 20- 10-14 0 100 200 300 400 500 600 700 800 900 1,000 1,100 UNITS OF OUTPUT a. The line H-B represents what type of cost? Hint: Variable cost / Fixed cost / Mixed cost total b. Production at point J versus point L would variable costs. Hint: Increase / Decrease c. What kind of cost is depicted by the line from point G to point A? Hint: Variable cost / Fixed cost / Mixed cost d. The breakeven points in units are units
Step by Step Solution
There are 3 Steps involved in it
1 Expert Approved Answer
Step: 1 Unlock

Question Has Been Solved by an Expert!
Get step-by-step solutions from verified subject matter experts
Step: 2 Unlock
Step: 3 Unlock