

Question: Question 4 (5 points) Write your work and answer to this question on the notebook paper (or graph paper) that you will turn into the

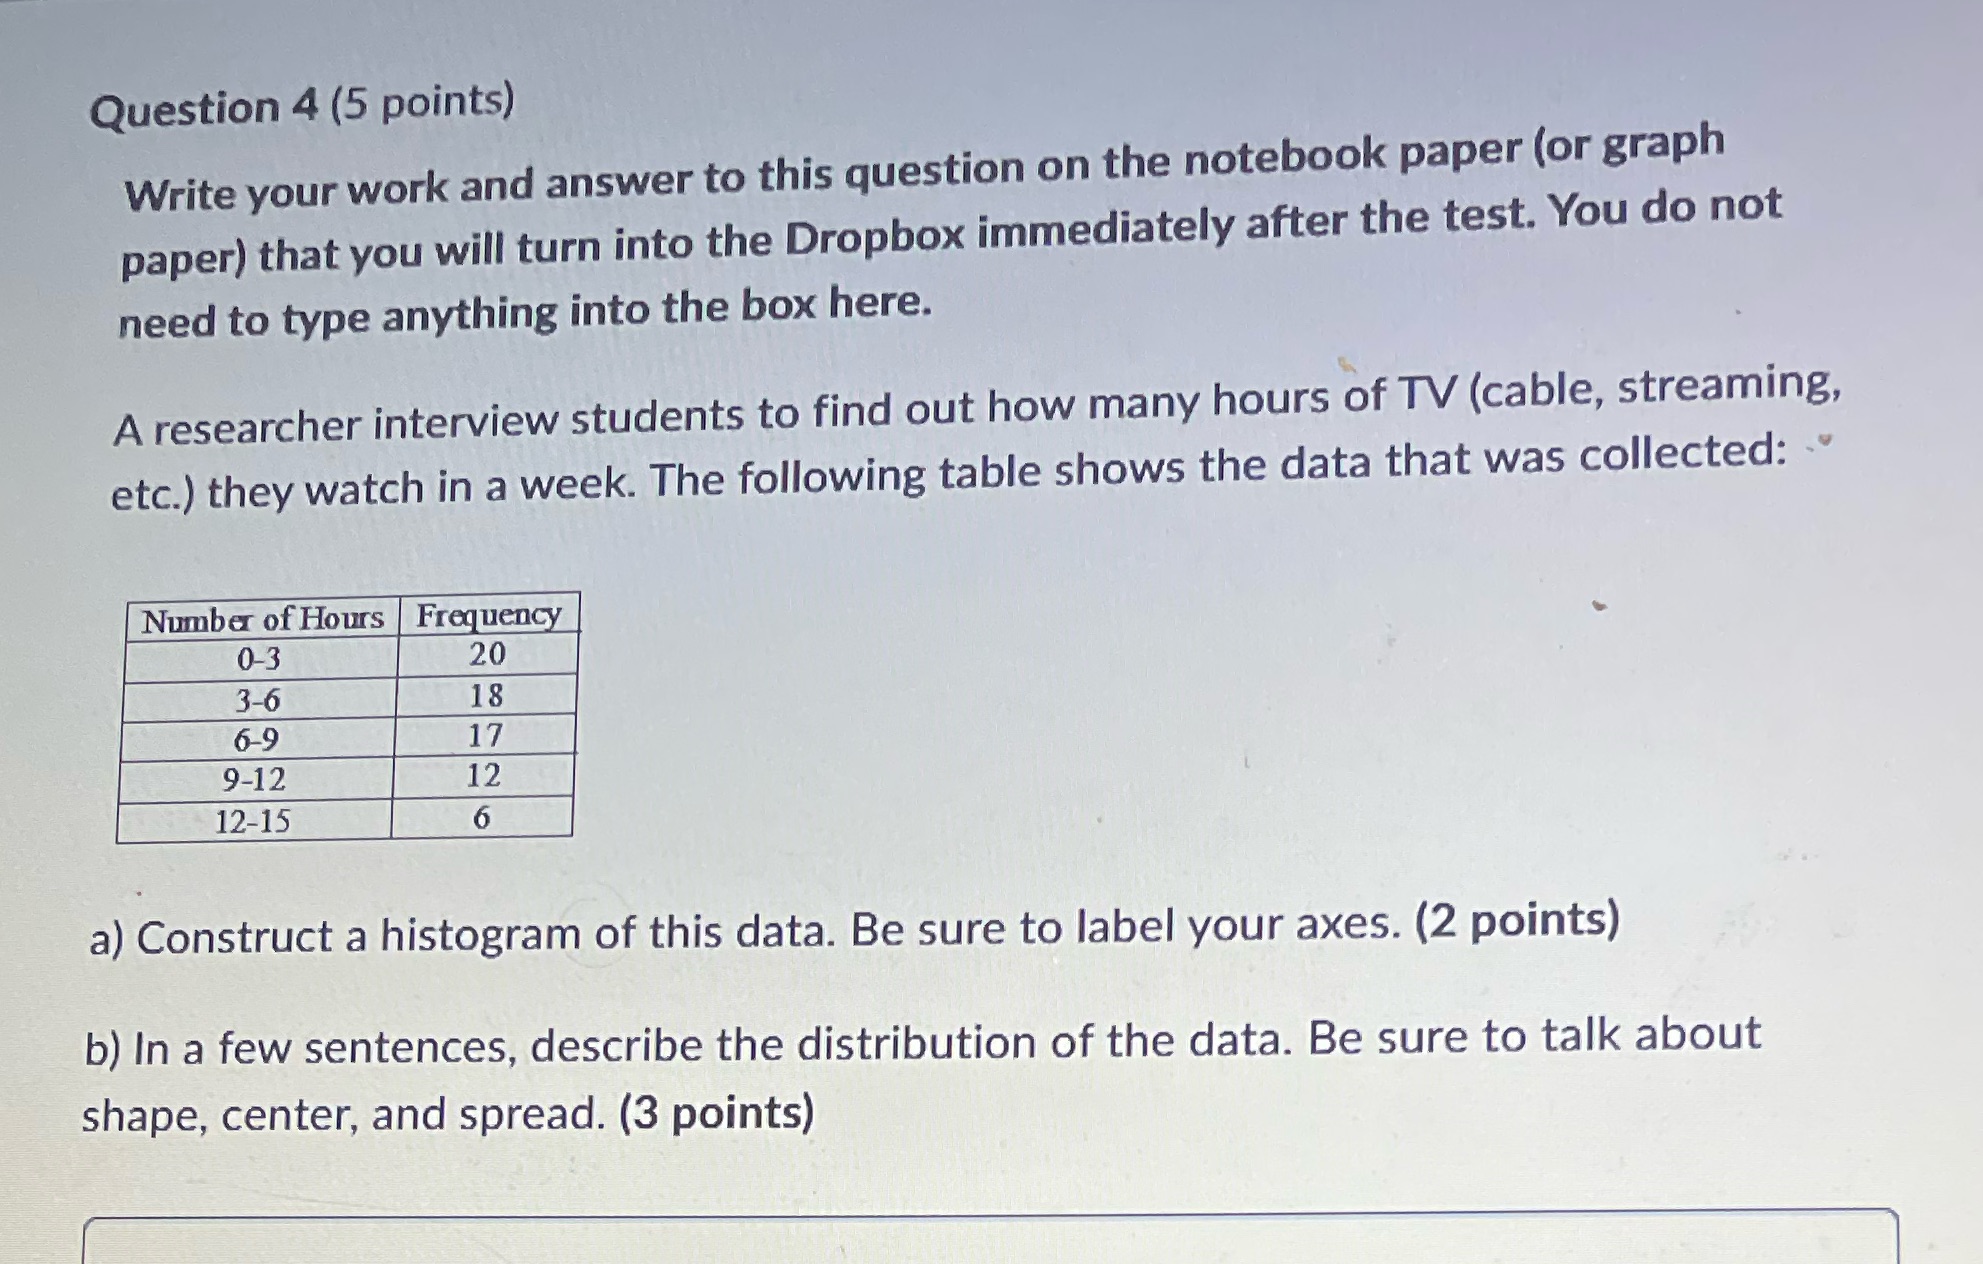
Question 4 (5 points) Write your work and answer to this question on the notebook paper (or graph paper) that you will turn into the Dropbox immediately after the test. You do not need to type anything into the box here. A researcher interview students to find out how many hours of TV (cable, streaming, etc.) they watch in a week. The following table shows the data that was collected: . Number of Hours Frequency 0-3 20 3-6 18 69 17 9-12 12 12-15 6 a) Construct a histogram of this data. Be sure to label your axes. (2 points) b) In a few sentences, describe the distribution of the data. Be sure to talk about shape, center, and spread. (3 points)
Step by Step Solution
There are 3 Steps involved in it
1 Expert Approved Answer
Step: 1 Unlock

Question Has Been Solved by an Expert!
Get step-by-step solutions from verified subject matter experts
Step: 2 Unlock
Step: 3 Unlock