

Question: Question 4 - 50 marks a.Refer to the diagrams below to describe the Tasmania's employment outlook compared to the national employment outlook.(10 marks) Labour Force
Question 4 - 50 marks
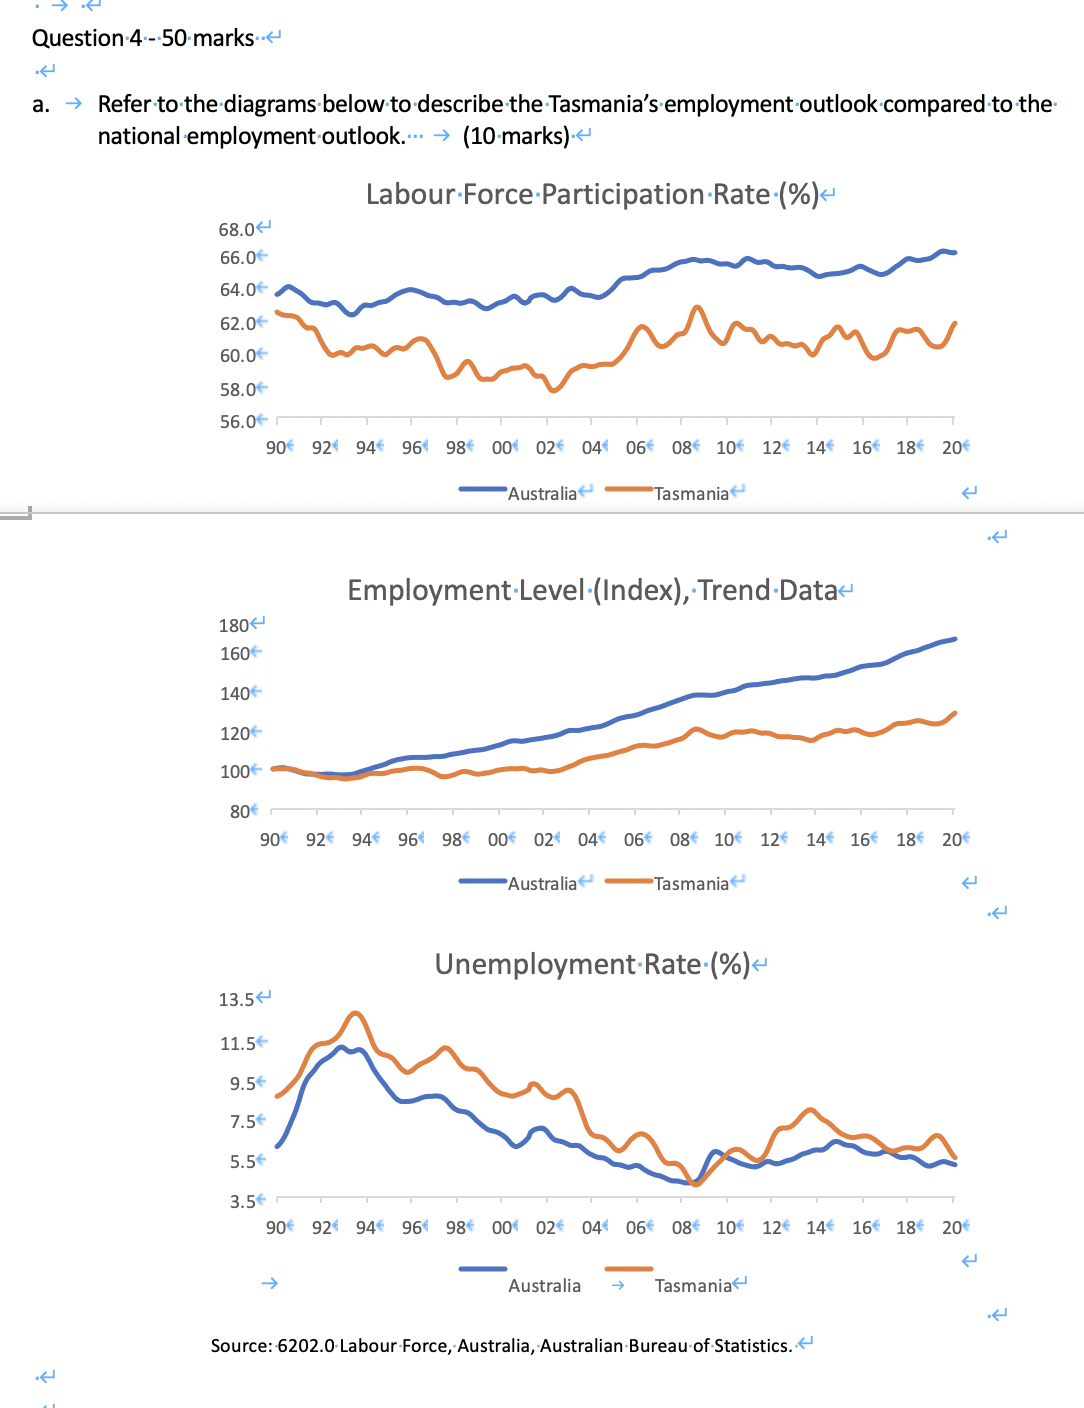
a.Refer to the diagrams below to describe the Tasmania's employment outlook compared to the national employment outlook.(10 marks)
Labour Force Participation Rate (%)
68.0
Employment Level (Index), Trend Data
180
Unemployment Rate (%)
13.5
AustraliaTasmania
Source: 6202.0 Labour Force, Australia, Australian Bureau of Statistics.
b.What factors could have caused the differences in
i.Labour force participation rate? (5 marks)
ii.Employment level? (5 marks)
iii.Between the period 2012 to 2015, why was the Tasmanian unemployment rate way higher than the national rate? (10 marks)
c.Macroeconomic conditions affect the decisions firms and families make. Why, for example, might a high school graduate from Tasmania enter the job market during an economic expansion, but apply to go to a Technical and Further Education (TAFE) college during a recession? What effect would this decision have on the official measure of the rate of unemployment in Tasmania?
(10 marks)
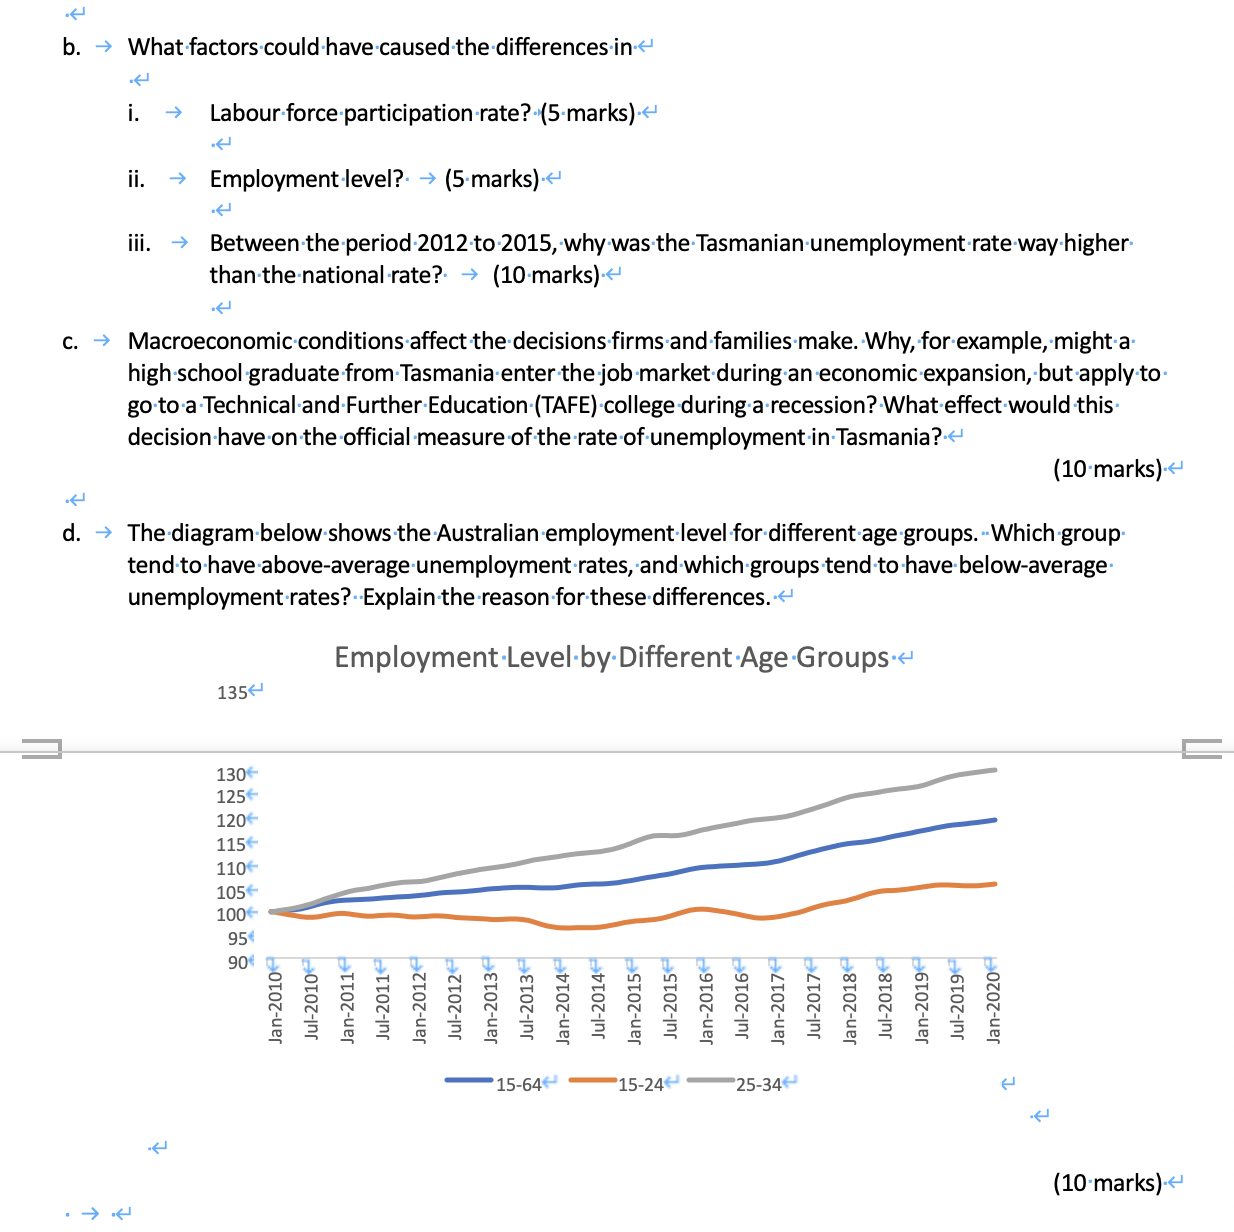
d.The diagram below shows the Australian employment level for different age groups.Which group tend to have above-average unemployment rates, and which groups tend to have below-average unemployment rates?Explain the reason for these differences.
Employment Level by Different Age Groups
135
Question.4-.50.marks. a. > Refer to the diagrams-below to describe the .Tasmania's employment outlook compared to the national employment outlook.... -> (10.marks). What factors could have caused the differences.in. Macroeconomic conditions affect the decisions.firms and families.make. Why, for example, might a. high school graduate from.Tasmania enter the job market during an economic expansion, but apply to. go to a.Technical and.Further Education (TAFE).college during a recession? What effect would this. decision have on the official measure of the rate of unemployment in Tasmania?. The diagram-below shows the Australian employment level for different age groups. .Which group. tend to have above-average unemployment rates, and which groups tend to have below-average unemployment rates? Explain the reason for these differences. .
Step by Step Solution
There are 3 Steps involved in it

Get step-by-step solutions from verified subject matter experts