

Question: Question 4 (6 Marks) (ILO BI, CI, C2) Read the comparative statement of financial position and the statement of financial performance of Imaginary Computers Limited.
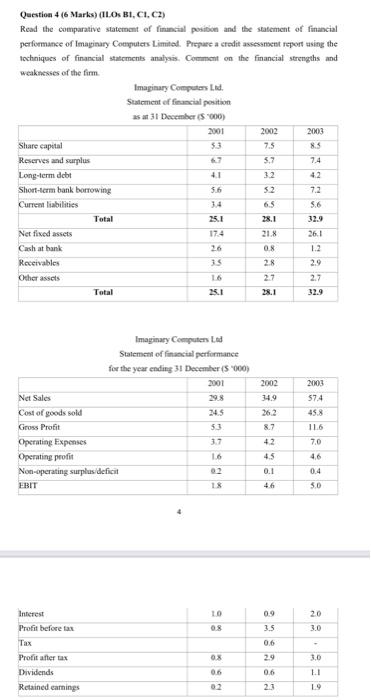
Question 4 (6 Marks) (ILO BI, CI, C2) Read the comparative statement of financial position and the statement of financial performance of Imaginary Computers Limited. Prepare a credit assessment report using the techniques of financial statements analyses. Comment on the financial strengths and weaknesses of the firm Imaginary Computers Statement of financial position as at 31 December (5000) 2001 2002 2003 Share capital 53 7.5 8.5 Reserves and surplus 5.7 7.4 Long-term debt 41 32 42 Short-term bank borrowing 5.6 52 7.2 Current liabilities 6.5 5.6 Total 25.1 28.1 32.9 Net fixed assets 174 21% 26.1 Cash at bank 0.8 1.2 Receivables 2.8 2.9 Other assets 16 2.7 2.7 Total I 32.9 2002 2003 34.9 574 Imaginary Computers Statement of financial performance for the year ending 31 December (5000) 2001 Net Sales Cost of goods sold 245 Gross Profit 53 Operating Expenses 1.7 Operating profit Non-operating surplus deficit EBIT 1X 8.7 116 42 4.5 70 4.6 9 0.1 0.4 5.0 10 0.9 20 3.0 3.5 0.6 Interest Profit before tax Tax Profit after tax Dividends Retained earnings OX 3.0 0.6 0.6 11 21 19 Question 4 (6 Marks) (ILO BI, CI, C2) Read the comparative statement of financial position and the statement of financial performance of Imaginary Computers Limited. Prepare a credit assessment report using the techniques of financial statements analyses. Comment on the financial strengths and weaknesses of the firm Imaginary Computers Statement of financial position as at 31 December (5000) 2001 2002 2003 Share capital 53 7.5 8.5 Reserves and surplus 5.7 7.4 Long-term debt 41 32 42 Short-term bank borrowing 5.6 52 7.2 Current liabilities 6.5 5.6 Total 25.1 28.1 32.9 Net fixed assets 174 21% 26.1 Cash at bank 0.8 1.2 Receivables 2.8 2.9 Other assets 16 2.7 2.7 Total I 32.9 2002 2003 34.9 574 Imaginary Computers Statement of financial performance for the year ending 31 December (5000) 2001 Net Sales Cost of goods sold 245 Gross Profit 53 Operating Expenses 1.7 Operating profit Non-operating surplus deficit EBIT 1X 8.7 116 42 4.5 70 4.6 9 0.1 0.4 5.0 10 0.9 20 3.0 3.5 0.6 Interest Profit before tax Tax Profit after tax Dividends Retained earnings OX 3.0 0.6 0.6 11 21 19
Step by Step Solution
There are 3 Steps involved in it

Get step-by-step solutions from verified subject matter experts