

Question: QUESTION 4 (6 marks): The following graph shows the efficient frontier for the portfolio containing x,y and z securities EFFICIENT FRONTIER 0.00525 D 0.00475 B
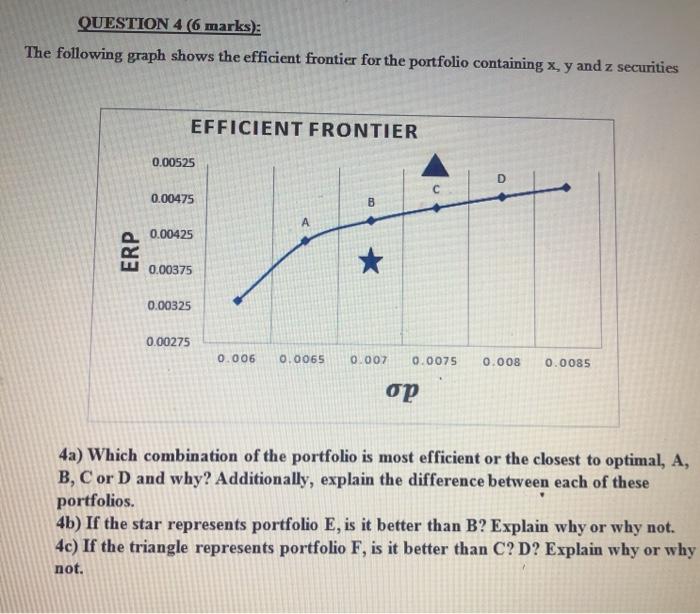
QUESTION 4 (6 marks): The following graph shows the efficient frontier for the portfolio containing x,y and z securities EFFICIENT FRONTIER 0.00525 D 0.00475 B 0.00425 ERP * 0.00375 0.00325 0.00275 0.006 0.0065 0.007 0.0075 0.008 0.0085 op 4a) Which combination of the portfolio is most efficient or the closest to optimal, A, B, C or D and why? Additionally, explain the difference between each of these portfolios. 4b) If the star represents portfolio E, is it better than B? Explain why or why not. 4c) If the triangle represents portfolio F, is it better than C? D? Explain why or why not
Step by Step Solution
There are 3 Steps involved in it
1 Expert Approved Answer
Step: 1 Unlock

Question Has Been Solved by an Expert!
Get step-by-step solutions from verified subject matter experts
Step: 2 Unlock
Step: 3 Unlock