

Question: QUESTION 4 ( a ) The data in Table Q 4 are from an undrained triaxial test on a sample of clay. The initial dimensions
QUESTION
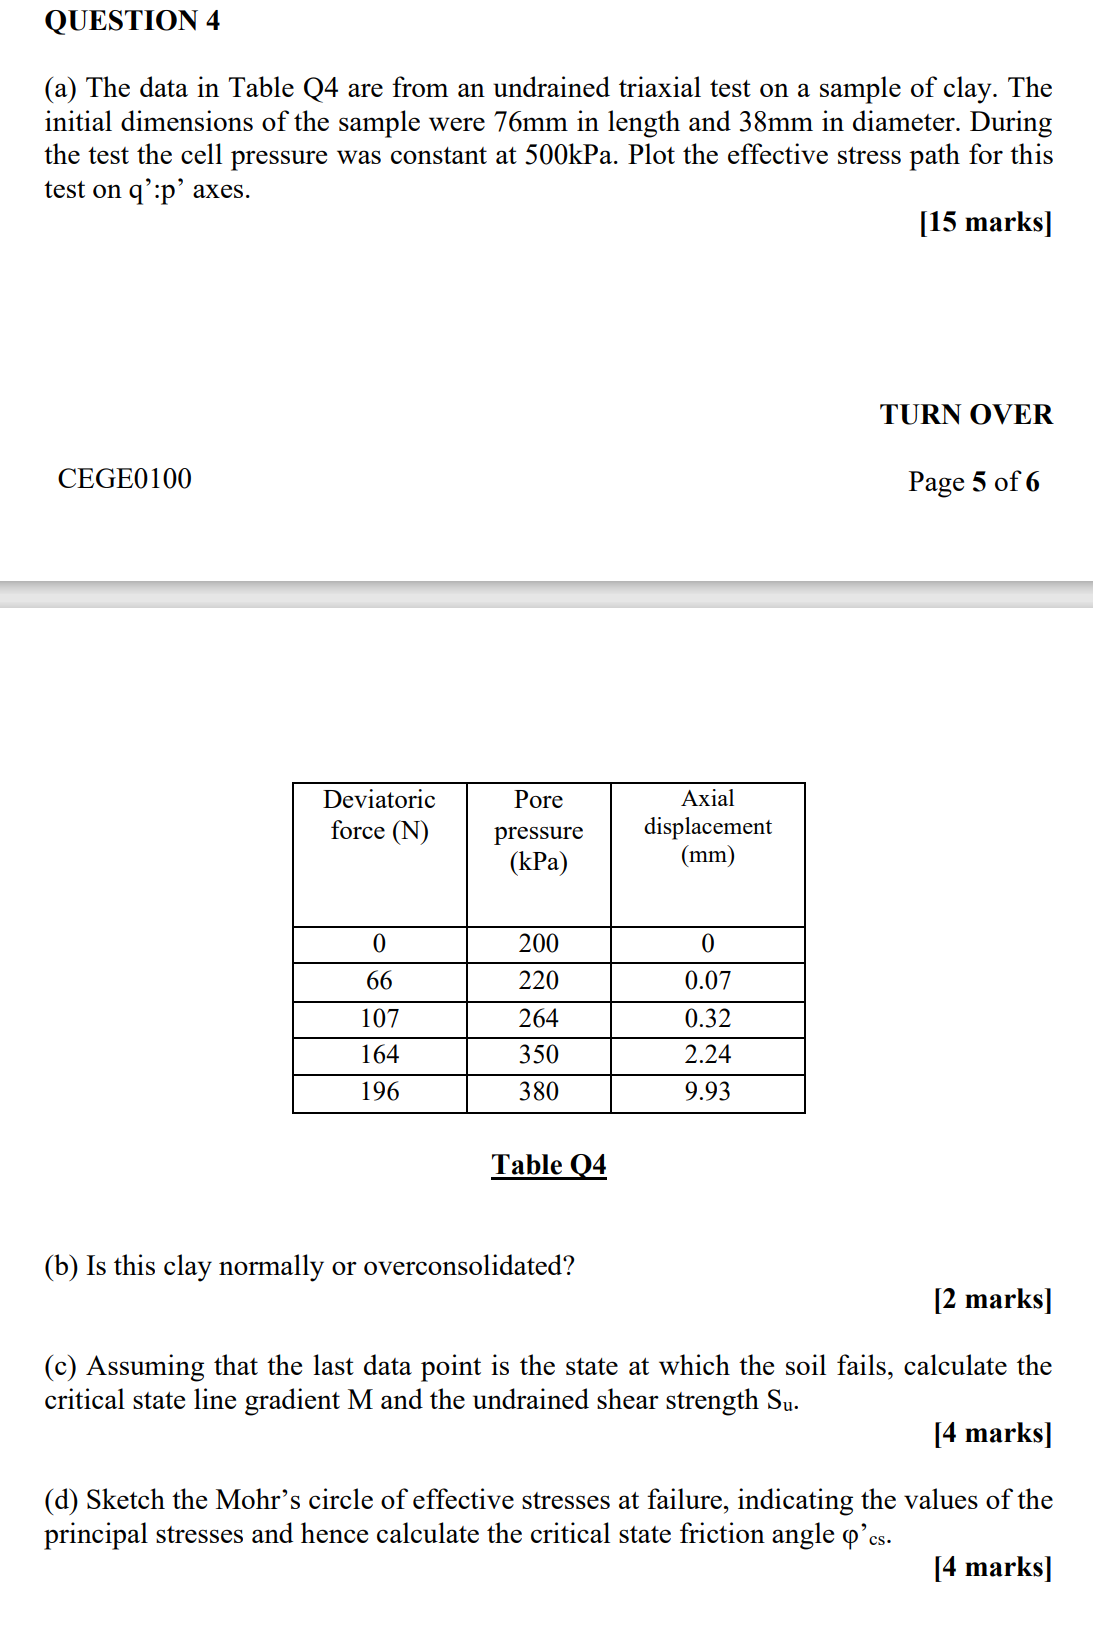
a The data in Table Q are from an undrained triaxial test on a sample of clay. The
initial dimensions of the sample were in length and in diameter. During
the test the cell pressure was constant at kPa. Plot the effective stress path for this
test on q:p axes.
marks
TURN OVER
CEGE
Page of
Table Q
b Is this clay normally or overconsolidated?
marks
c Assuming that the last data point is the state at which the soil fails, calculate the
critical state line gradient and the undrained shear strength
marks
d Sketch the Mohr's circle of effective stresses at failure, indicating the values of the
principal stresses and hence calculate the critical state friction angle cs
Step by Step Solution
There are 3 Steps involved in it
1 Expert Approved Answer
Step: 1 Unlock

Question Has Been Solved by an Expert!
Get step-by-step solutions from verified subject matter experts
Step: 2 Unlock
Step: 3 Unlock