

Question: A) The following data give the score in a quiz (total mark of 5) of 30 MA 102 students. 2.03 4.89 5.00 5.00 3.85
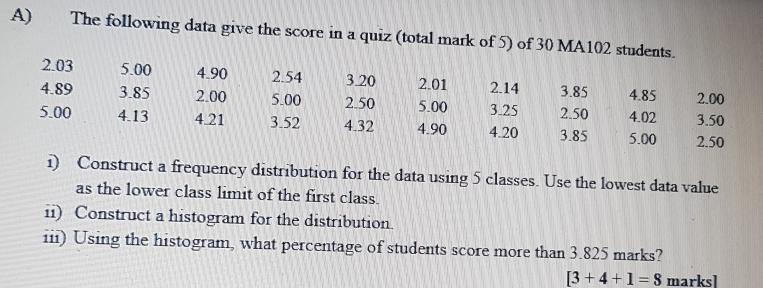
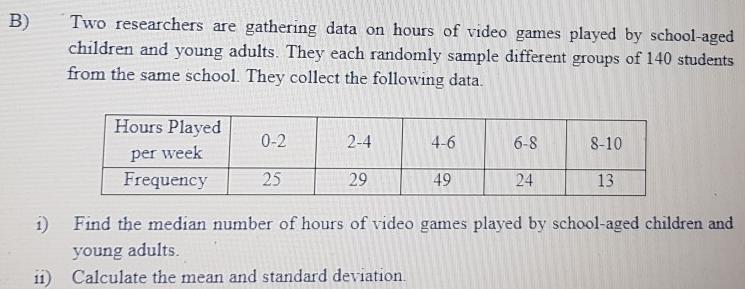
A) The following data give the score in a quiz (total mark of 5) of 30 MA 102 students. 2.03 4.89 5.00 5.00 3.85 4.13 4.90 2.00 4.21 2.54 5.00 3.52 3.20 2.50 4.32 2.01 5.00 4.90 2.14 3.25 4.20 3.85 2.50 3.85 4.85 4.02 5.00 2.00 3.50 2.50 1) Construct a frequency distribution for the data using 5 classes. Use the lowest data value as the lower class limit of the first class. 11) Construct a histogram for the distribution. 111) Using the histogram, what percentage of students score more than 3.825 marks? [3+4+1=8 marks] B) Two researchers are gathering data on hours of video games played by school-aged children and young adults. They each randomly sample different groups of 140 students from the same school. They collect the following data. 11) Hours Played per week Frequency 0-2 25 2-4 29 4-6 49 6-8 24 8-10 13 1) Find the median number of hours of video games played by school-aged children and young adults. Calculate the mean and standard deviation.
Step by Step Solution
3.63 Rating (153 Votes )
There are 3 Steps involved in it
Part A i Construct a frequency distribution for the data using 5 classes 1 Find the range Minimum va... View full answer

Get step-by-step solutions from verified subject matter experts