

Question: Question 4 (a) The following graph shows a time series of returns from the NASDAQ index. Discuss the behaviour of the returns with reference to
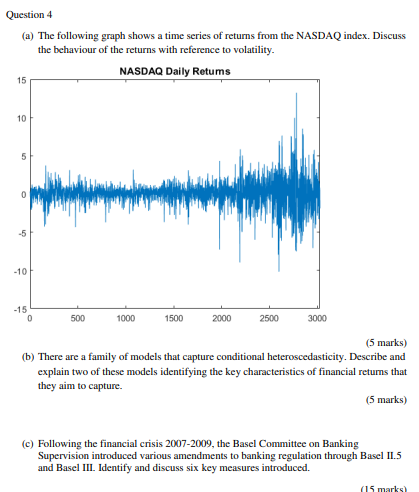
Question 4 (a) The following graph shows a time series of returns from the NASDAQ index. Discuss the behaviour of the returns with reference to volatility. NASDAQ Daily Retums 15 10 5 0 -5 -10 -15 500 1000 1500 2000 2500 3000 (5 marks) (b) There are a family of models that capture conditional heteroscedasticity. Describe and explain two of these models identifying the key characteristics of financial returns that they aim to capture (5 marks) (c) Following the financial crisis 2007-2009, the Basel Committee on Banking Supervision introduced various amendments to banking regulation through Basel II.5 and Basel III. Identify and discuss six key measures introduced. (15 marks Question 4 (a) The following graph shows a time series of returns from the NASDAQ index. Discuss the behaviour of the returns with reference to volatility. NASDAQ Daily Retums 15 10 5 0 -5 -10 -15 500 1000 1500 2000 2500 3000 (5 marks) (b) There are a family of models that capture conditional heteroscedasticity. Describe and explain two of these models identifying the key characteristics of financial returns that they aim to capture (5 marks) (c) Following the financial crisis 2007-2009, the Basel Committee on Banking Supervision introduced various amendments to banking regulation through Basel II.5 and Basel III. Identify and discuss six key measures introduced. (15 marks
Step by Step Solution
There are 3 Steps involved in it

Get step-by-step solutions from verified subject matter experts