

Question: QUESTION 4: Analyse your companys leverage ratio in 2020 compared to 2019 and 2018. Use two leverage ratios to support your answer which are total
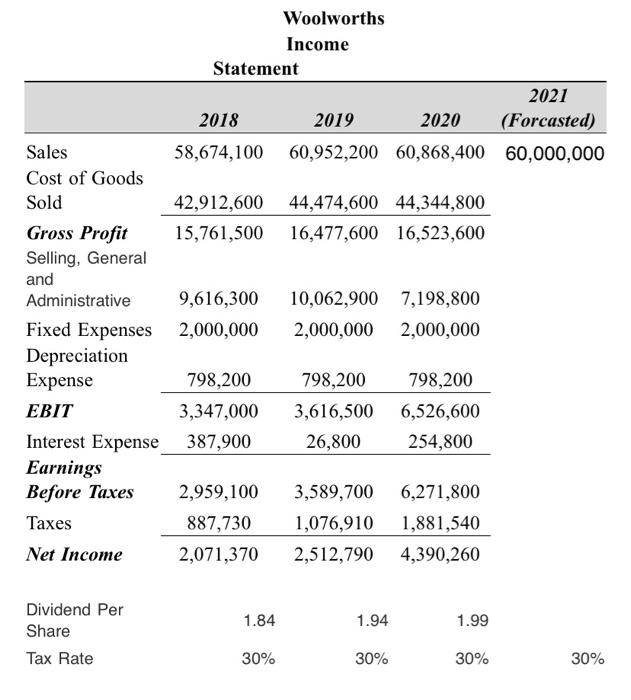
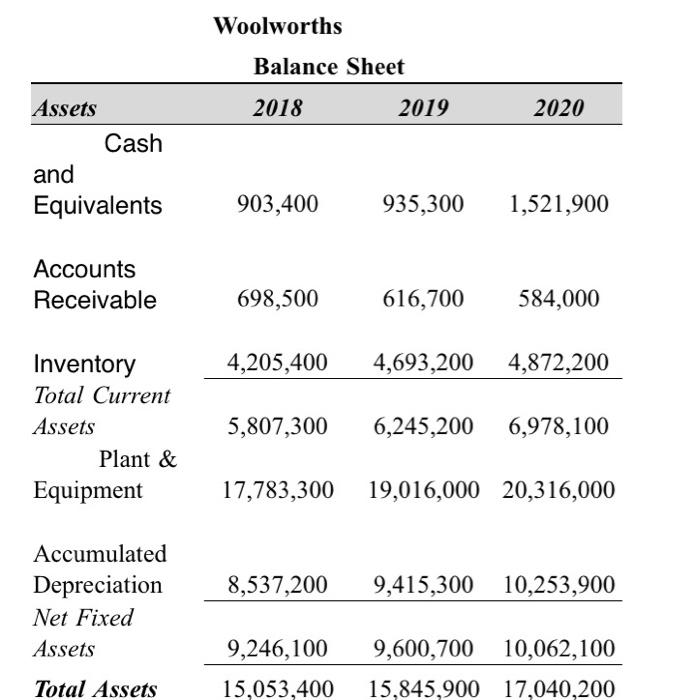
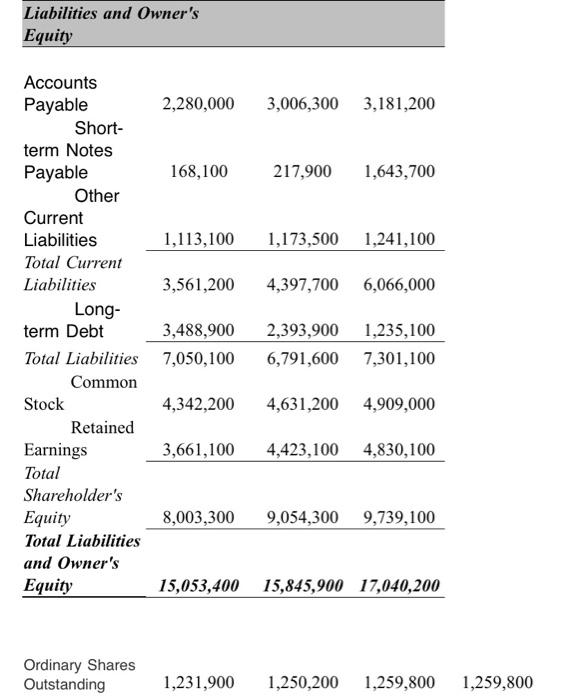
Woolworths Income Statement 2021 2018 2019 2020 (Forcasted) Sales 58,674,100 60,952,200 60,868,400 60,000,000 Cost of Goods Sold 42,912,600 44,474,600 44,344,800 Gross Profit 15,761,500 16,477,600 16,523,600 Selling, General and Administrative 9,616,300 10,062,900 7,198,800 Fixed Expenses 2,000,000 2,000,000 2,000,000 Depreciation Expense 798,200 798,200 798,200 EBIT 3,347,000 3,616,500 6,526,600 Interest Expense 387,900 26,800 254,800 Earnings Before Taxes 2,959,100 3,589,700 6,271,800 Taxes 887,730 1,076,910 1,881,540 Net Income 2,071,370 2,512,790 4,390,260 1.84 1.94 1.99 Dividend Per Share Tax Rate 30% 30% 30% 30% Woolworths Balance Sheet 2018 2019 2020 Assets Cash and Equivalents 903,400 935,300 1,521,900 Accounts Receivable 698,500 616,700 584,000 4,205,400 4,693,200 4,872,200 Inventory Total Current Assets Plant & Equipment 5,807,300 6,245,200 6,978,100 17,783,300 19,016,000 20,316,000 8,537,200 Accumulated Depreciation Net Fixed Assets 9,415,300 10,253,900 9,246,100 9,600,700 10,062,100 15,845,900 17,040,200 Total Assets 15,053,400 Liabilities and Owner's Equity Accounts Payable 2,280,000 3,006,300 3,181,200 Short- term Notes Payable 168,100 217,900 1,643,700 Other Current Liabilities 1,113,100 1,173,500 1,241,100 Total Current Liabilities 3,561,200 4,397,700 6,066,000 Long- term Debt 3,488,900 2,393,900 1,235,100 Total Liabilities 7,050,100 6,791,600 7,301,100 Common Stock 4,342,200 4,631,200 4,909,000 Retained Earnings 3,661,100 4,423,100 4,830,100 Total Shareholder's Equity 8,003,300 9,054,300 9,739,100 Total Liabilities and Owner's Equity 15,053,400 15,845,900 17,040,200 Ordinary Shares Outstanding 1,231,900 1,250,200 1,259,800 1,259,800 Woolworths Income Statement 2021 2018 2019 2020 (Forcasted) Sales 58,674,100 60,952,200 60,868,400 60,000,000 Cost of Goods Sold 42,912,600 44,474,600 44,344,800 Gross Profit 15,761,500 16,477,600 16,523,600 Selling, General and Administrative 9,616,300 10,062,900 7,198,800 Fixed Expenses 2,000,000 2,000,000 2,000,000 Depreciation Expense 798,200 798,200 798,200 EBIT 3,347,000 3,616,500 6,526,600 Interest Expense 387,900 26,800 254,800 Earnings Before Taxes 2,959,100 3,589,700 6,271,800 Taxes 887,730 1,076,910 1,881,540 Net Income 2,071,370 2,512,790 4,390,260 1.84 1.94 1.99 Dividend Per Share Tax Rate 30% 30% 30% 30% Woolworths Balance Sheet 2018 2019 2020 Assets Cash and Equivalents 903,400 935,300 1,521,900 Accounts Receivable 698,500 616,700 584,000 4,205,400 4,693,200 4,872,200 Inventory Total Current Assets Plant & Equipment 5,807,300 6,245,200 6,978,100 17,783,300 19,016,000 20,316,000 8,537,200 Accumulated Depreciation Net Fixed Assets 9,415,300 10,253,900 9,246,100 9,600,700 10,062,100 15,845,900 17,040,200 Total Assets 15,053,400 Liabilities and Owner's Equity Accounts Payable 2,280,000 3,006,300 3,181,200 Short- term Notes Payable 168,100 217,900 1,643,700 Other Current Liabilities 1,113,100 1,173,500 1,241,100 Total Current Liabilities 3,561,200 4,397,700 6,066,000 Long- term Debt 3,488,900 2,393,900 1,235,100 Total Liabilities 7,050,100 6,791,600 7,301,100 Common Stock 4,342,200 4,631,200 4,909,000 Retained Earnings 3,661,100 4,423,100 4,830,100 Total Shareholder's Equity 8,003,300 9,054,300 9,739,100 Total Liabilities and Owner's Equity 15,053,400 15,845,900 17,040,200 Ordinary Shares Outstanding 1,231,900 1,250,200 1,259,800 1,259,800
Step by Step Solution
There are 3 Steps involved in it

Get step-by-step solutions from verified subject matter experts