

Question: Question 4: Answer the following questions based on regression output given below: a) State the null and alternate hypothesis which is tested in the ANOVA
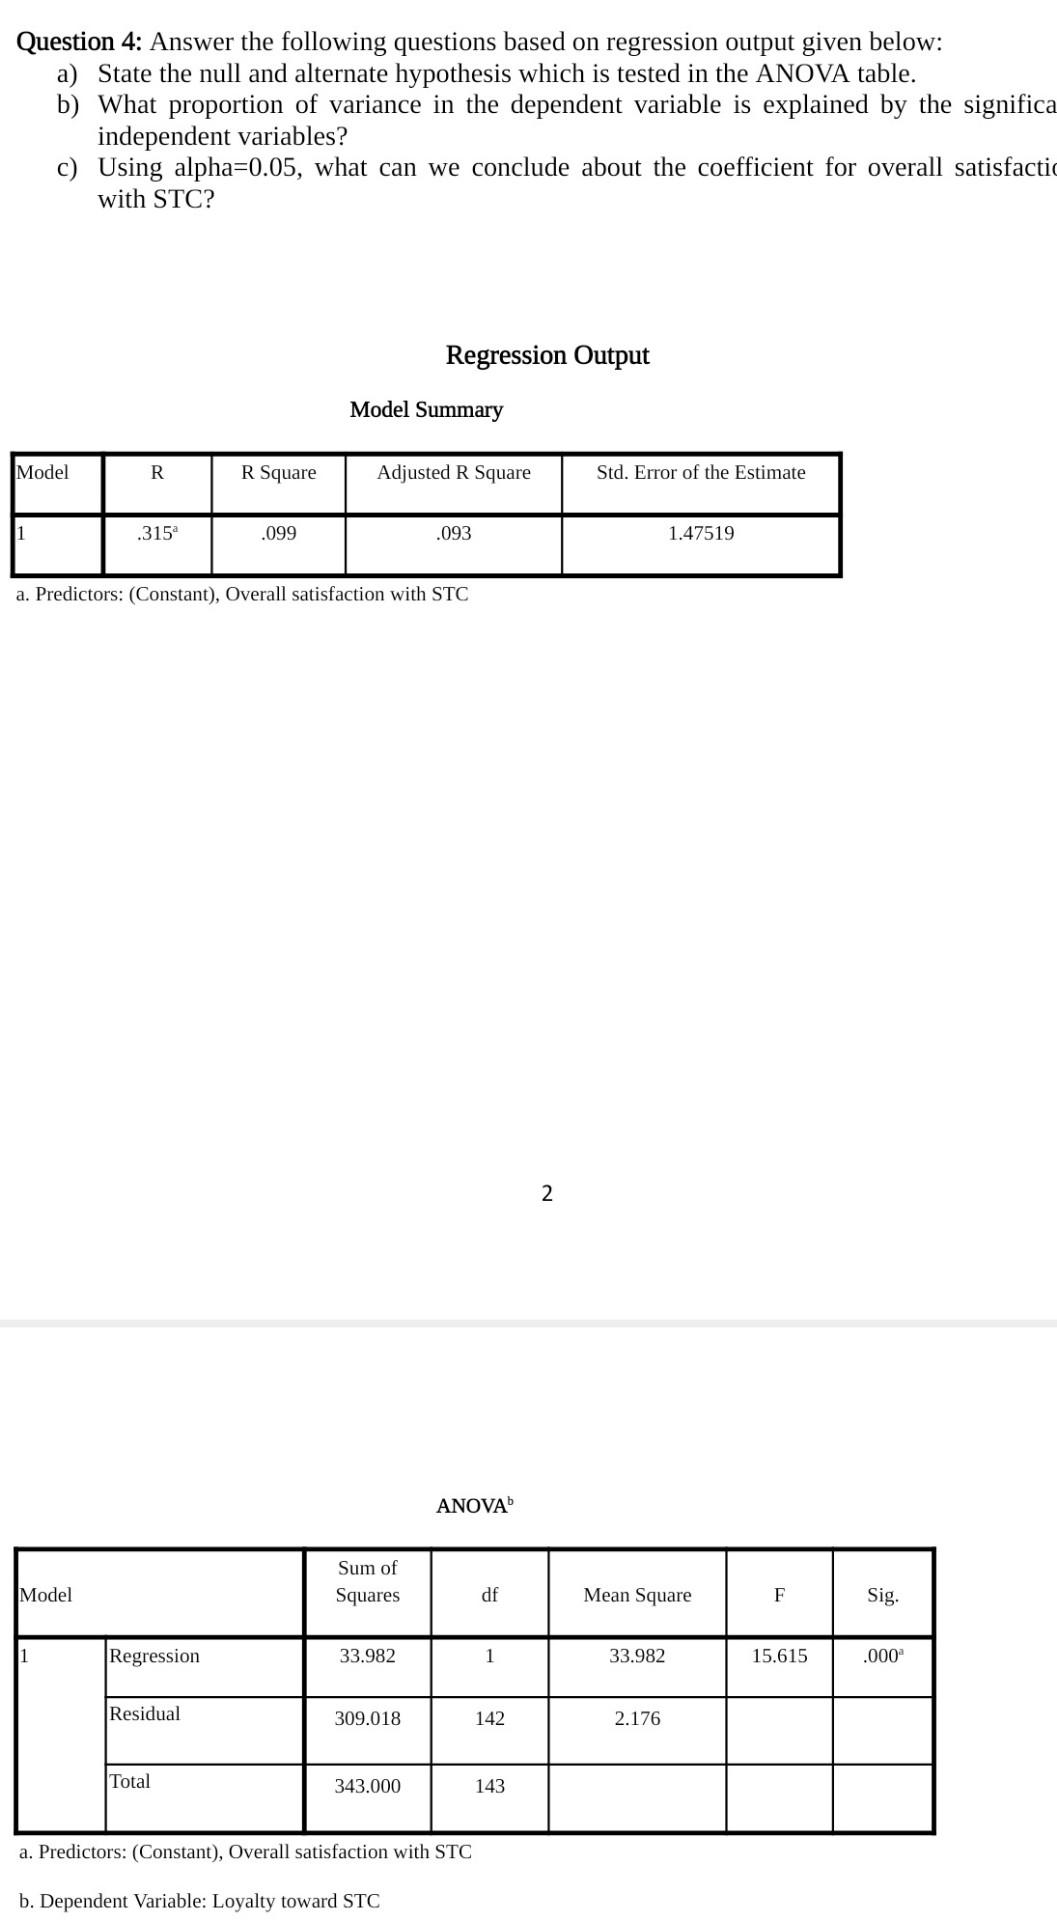
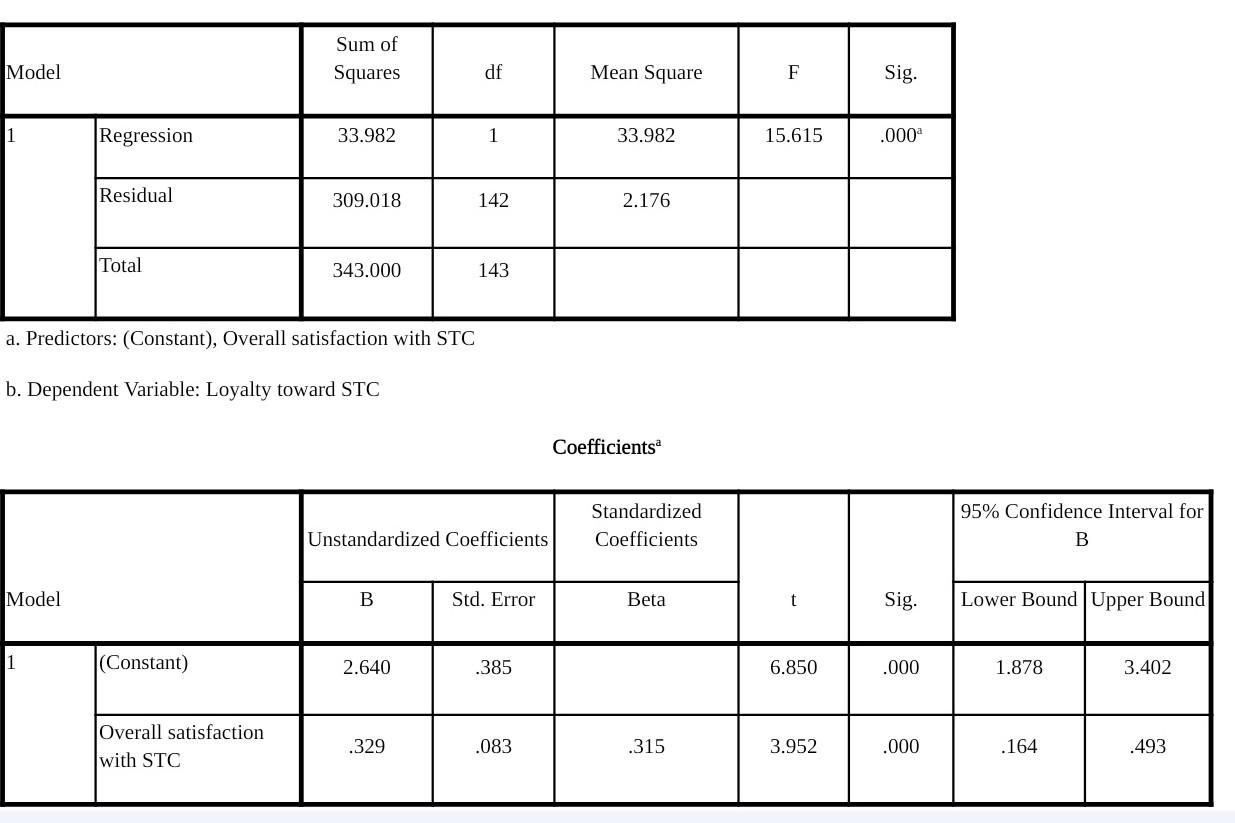
Question 4: Answer the following questions based on regression output given below: a) State the null and alternate hypothesis which is tested in the ANOVA table. b) What proportion of variance in the dependent variable is explained by the significa independent variables? c) Using alpha=0.05, what can we conclude about the coefficient for overall satisfactic with STC? Regression Output Model Summary Model R R Square Adjusted R Square Std. Error of the Estimate 1 .3152 .099 .093 1.47519 a. Predictors: (Constant), Overall satisfaction with STC 2 ANOVA Sum of Squares Model df Mean Square F Sig. 1 Regression 33.982 1 33.982 15.615 .000 Residual 309.018 142 2.176 Total 343.000 143 a. Predictors: (Constant), Overall satisfaction with STC b. Dependent Variable: Loyalty toward STC Sum of Squares Model df Mean Square F Sig. 1 Regression 33.982 1 33.982 15.615 .000 Residual 309.018 142 2.176 Total 343.000 143 a. Predictors: (Constant), Overall satisfaction with STC b. Dependent Variable: Loyalty toward STC Coefficientsa Standardized Coefficients 95% Confidence Interval for B Unstandardized Coefficients Model B Std. Error Beta t Sig. Lower Bound Upper Bound 1 (Constant) 2.640 .385 6.850 .000 1.878 3.402 Overall satisfaction with STC .329 .083 .315 3.952 .000 .164 .493
Step by Step Solution
There are 3 Steps involved in it
1 Expert Approved Answer
Step: 1 Unlock

Question Has Been Solved by an Expert!
Get step-by-step solutions from verified subject matter experts
Step: 2 Unlock
Step: 3 Unlock