

Question: Question 4: Capital Asset Pricing Models (CAPM) The CAPM relates the sensitivity of an individual companys stock returns to the returns of the market as
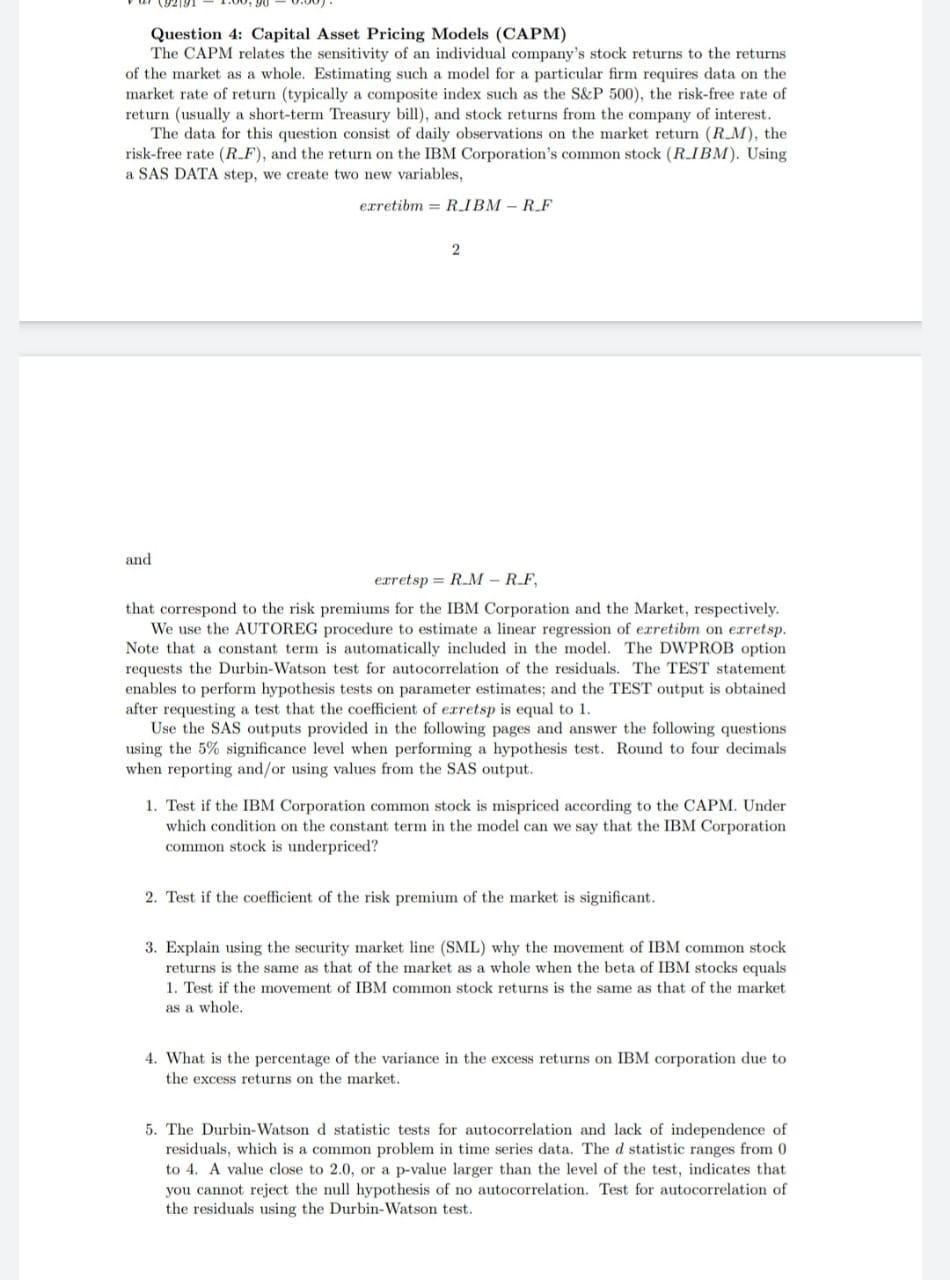
Question 4: Capital Asset Pricing Models (CAPM)
The CAPM relates the sensitivity of an individual companys stock returns to the returns
of the market as a whole. Estimating such a model for a particular firm requires data on the
market rate of return (typically a composite index such as the S&P 500), the risk-free rate of
return (usually a short-term Treasury bill), and stock returns from the company of interest.
The data for this question consist of daily observations on the market return (R M), the
risk-free rate (R F), and the return on the IBM Corporations common stock (R IBM). Using
a SAS DATA step, we create two new variables,
exretibm = R IBM R F
and
exretsp = R M R F,
that correspond to the risk premiums for the IBM Corporation and the Market, respectively.
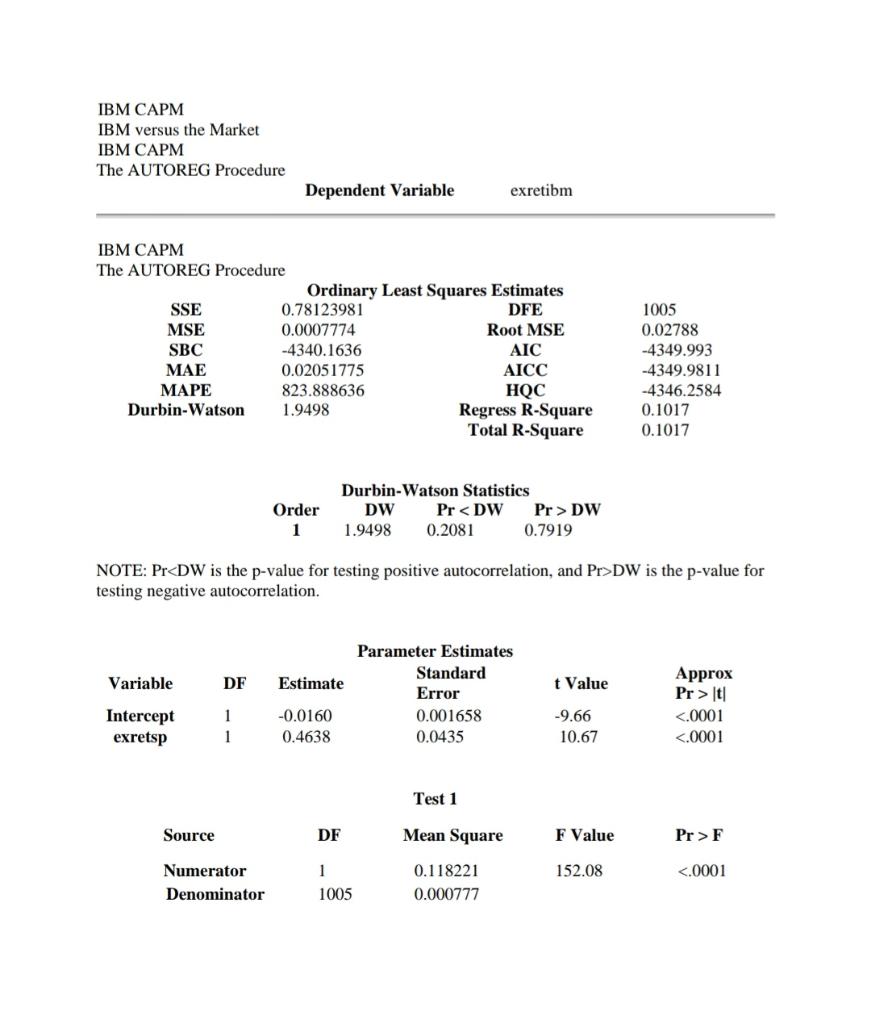
We use the AUTOREG procedure to estimate a linear regression of exretibm on exretsp.
Note that a constant term is automatically included in the model. The DWPROB option
requests the Durbin-Watson test for autocorrelation of the residuals. The TEST statement
enables to perform hypothesis tests on parameter estimates; and the TEST output is obtained
after requesting a test that the coefficient of exretsp is equal to 1.
Use the SAS outputs provided in the following pages and answer the following questions
using the 5% significance level when performing a hypothesis test. Round to four decimals
when reporting and/or using values from the SAS output.
1. Test if the IBM Corporation common stock is mispriced according to the CAPM. Under
which condition on the constant term in the model can we say that the IBM Corporation
common stock is underpriced?
2. Test if the coefficient of the risk premium of the market is significant.
3. Explain using the security market line (SML) why the movement of IBM common stock
returns is the same as that of the market as a whole when the beta of IBM stocks equals
1. Test if the movement of IBM common stock returns is the same as that of the market
as a whole.
4. What is the percentage of the variance in the excess returns on IBM corporation due to
the excess returns on the market.
5. The Durbin-Watson d statistic tests for autocorrelation and lack of independence of
residuals, which is a common problem in time series data. The d statistic ranges from 0
to 4. A value close to 2.0, or a p-value larger than the level of the test, indicates that
you cannot reject the null hypothesis of no autocorrelation. Test for autocorrelation of
the residuals using the Durbin-Watson test.
IBM CAPM
IBM versus the Market
IBM CAPM
The AUTOREG Procedure
Dependent Variable exretibm
IBM CAPM
The AUTOREG Procedure
Ordinary Least Squares Estimates
SSE 0.78123981 DFE 1005
MSE 0.0007774 Root MSE 0.02788
SBC -4340.1636 AIC -4349.993
MAE 0.02051775 AICC -4349.9811
MAPE 823.888636 HQC -4346.2584
Durbin-Watson 1.9498 Regress R-Square 0.1017
Total R-Square 0.1017
Durbin-Watson Statistics
Order DW Pr DW
1 1.9498 0.2081 0.7919
NOTE: Pr
testing negative autocorrelation.
Parameter Estimates
Variable DF Estimate Standard
Error t Value Approx
Pr > |t|
Intercept 1 -0.0160 0.001658 -9.66 <.0001>
exretsp 1 0.4638 0.0435 10.67 <.0001>
Test 1
Source DF Mean Square F Value Pr > F
Numerator 1 0.118221 152.08 <.0001>
Denominator 1005 0.000777
Question 4: Capital Asset Pricing Models (CAPM) The CAPM relates the sensitivity of an individual company's stock returns to the returns of the market as a whole. Estimating such a model for a particular firm requires data on the market rate of return (typically a composite index such as the S&P 500), the risk-free rate of return (usually a short-term Treasury bill), and stock returns from the company of interest. The data for this question consist of daily observations on the market return (RM), the risk-free rate (R.F), and the return on the IBM Corporation's common stock (R.IBM). Using a SAS DATA step, we create two new variables, ezretibm = RIBM -RF 2 and erretsp = RM -RF, that correspond to the risk premiums for the IBM Corporation and the Market, respectively. We use the AUTOREG procedure to estimate a linear regression of exretibm on erret sp. Note that a constant term is automatically included in the model. The DWPROB option requests the Durbin-Watson test for autocorrelation of the residuals. The TEST statement enables to perform hypothesis tests on parameter estimates, and the TEST output is obtained after requesting a test that the coefficient of exretsp is equal to 1. Use the SAS outputs provided in the following pages and answer the following questions using the 5% significance level when performing a hypothesis test. Round to four decimals when reporting and/or using values from the SAS output. 1. Test if the IBM Corporation common stock is mispriced according to the CAPM. Under which condition on the constant term in the model can we say that the IBM Corporation common stock is underpriced? 2. Test if the coefficient of the risk premium of the market is significant. 3. Explain using the security market line (SML) why the movement of IBM common stock returns is the same as that of the market as a whole when the beta of IBM stocks equals 1. Test if the movement of IBM common stock returns is the same as that of the market as a whole. 4. What is the percentage of the variance in the excess returns on IBM corporation due to the excess returns on the market. 5. The Durbin-Watson d statistic tests for autocorrelation and lack of independence of residuals, which is a common problem in time series data. The d statistic ranges from 0 to 4. A value close to 2.0, or a p-value larger than the level of the test, indicates that you cannot reject the null hypothesis of no autocorrelation. Test for autocorrelation of the residuals using the Durbin-Watson test. IBM CAPM IBM versus the Market IBM CAPM The AUTOREG Procedure Dependent Variable exretibm IBM CAPM The AUTOREG Procedure Ordinary Least Squares Estimates SSE 0.78123981 DFE MSE 0.0007774 Root MSE SBC -4340.1636 AIC MAE 0.02051775 AICC MAPE 823.888636 HQC Durbin-Watson 1.9498 Regress R-Square Total R-Square 1005 0.02788 -4349.993 -4349.9811 -4346.2584 0.1017 0.1017 Order 1 Durbin-Watson Statistics DW Pr
Step by Step Solution
There are 3 Steps involved in it

Get step-by-step solutions from verified subject matter experts