

Question: Question 4 Consider the chart below: (a) Notice that for the above graph there is a perfect linear separator for the two input classes. Therefore,
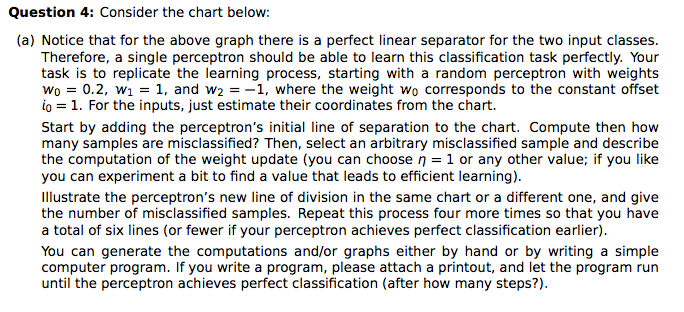
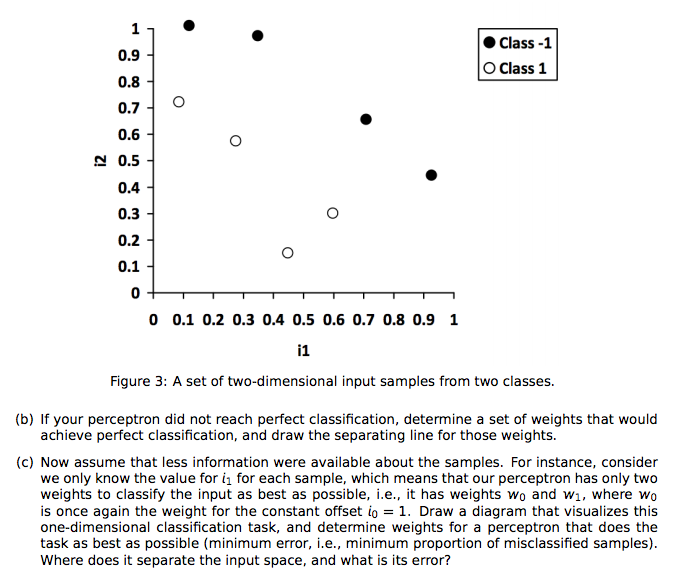
Question 4 Consider the chart below: (a) Notice that for the above graph there is a perfect linear separator for the two input classes. Therefore, a single perceptron should be able to learn this classification task perfectly. Your task is to replicate the learning process, starting with a random perceptron with weights Wo 0.2, w1 1, and w2 1, where the weight wo corresponds to the constant offset io 31. For the inputs, just estimate their coordinates from the chart. Start by adding the perceptron's initial line of separation to the chart. Compute then how many samples are misclassified? Then, select an arbitrary misclassified sample and describe the computation of the weight update (you can choose n 1 or any other value; if you like you can experiment a bit to find a value that leads to efficient learning). Illustrate the perceptron's new line of division in the same chart or a different one, and give the number of misclassified samples. Repeat this process four more times so that you have a total of six lines (or fewer if your perceptron achieves perfect classification earlier). You can generate the computations and/or graphs either by hand or by writing a simple computer program. If you write a program, please attach a printout, and let the program run until the perceptron achieves perfect classification (after how many steps?) Question 4 Consider the chart below: (a) Notice that for the above graph there is a perfect linear separator for the two input classes. Therefore, a single perceptron should be able to learn this classification task perfectly. Your task is to replicate the learning process, starting with a random perceptron with weights Wo 0.2, w1 1, and w2 1, where the weight wo corresponds to the constant offset io 31. For the inputs, just estimate their coordinates from the chart. Start by adding the perceptron's initial line of separation to the chart. Compute then how many samples are misclassified? Then, select an arbitrary misclassified sample and describe the computation of the weight update (you can choose n 1 or any other value; if you like you can experiment a bit to find a value that leads to efficient learning). Illustrate the perceptron's new line of division in the same chart or a different one, and give the number of misclassified samples. Repeat this process four more times so that you have a total of six lines (or fewer if your perceptron achieves perfect classification earlier). You can generate the computations and/or graphs either by hand or by writing a simple computer program. If you write a program, please attach a printout, and let the program run until the perceptron achieves perfect classification (after how many steps?)
Step by Step Solution
There are 3 Steps involved in it

Get step-by-step solutions from verified subject matter experts