

Question: Question 4 - Creating a Lineweaver Burk Plot (10 marks) Take your data from the table in question 2 above, and take the reciprocal of
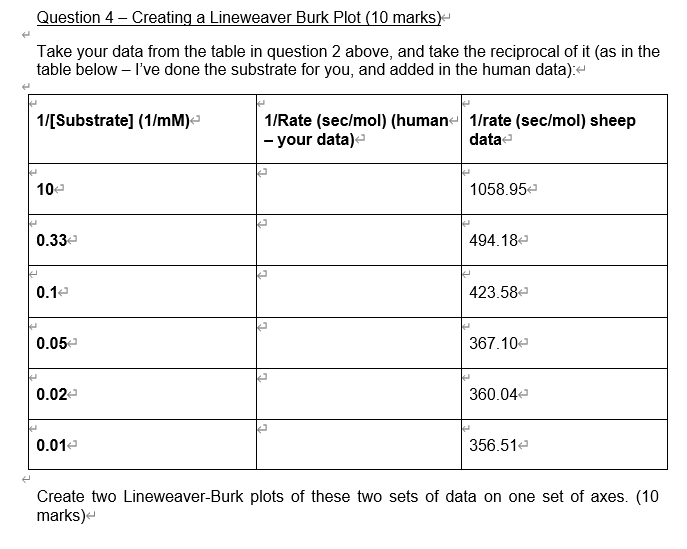
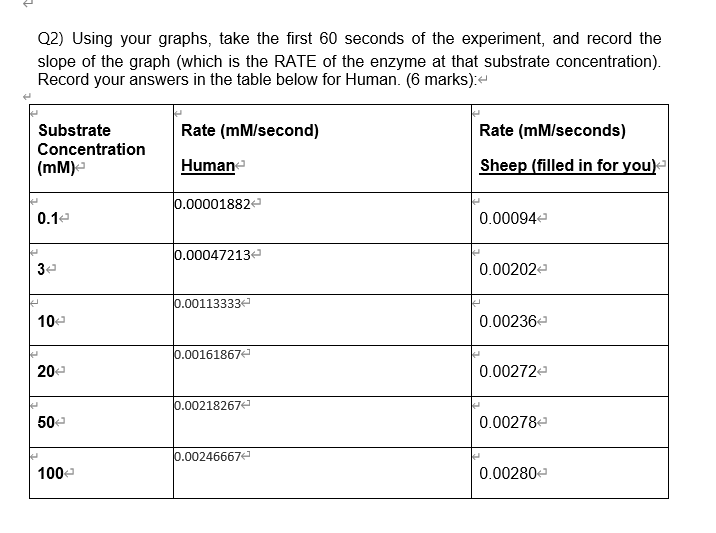
Question 4 - Creating a Lineweaver Burk Plot (10 marks) Take your data from the table in question 2 above, and take the reciprocal of it (as in the table below - I've done the substrate for you, and added in the human data): 1/[Substrate] (1/mm) 1/Rate (sec/mol) (human+ 1/rate (sec/mol) sheep - your data) data- 10 1058.954 0.33 494.18 0.12 423.58 t 0.05 367.104 0.02 360.044 14 0.012 356.51e Create two Lineweaver-Burk plots of these two sets of data on one set of axes. (10 marks) Q2) Using your graphs, take the first 60 seconds of the experiment, and record the slope of the graph (which is the RATE of the enzyme at that substrate concentration). Record your answers in the table below for Human. (6 marks): Rate (mM/second) Rate (mM/seconds) Substrate Concentration (mm) Human Sheep (filled in for you) 0.000018822 0.12 0.000942 0.00047213 3e 0.002022 0.00113333 10 0.00236 0.001618672 20 0.00272- 0.002182672 50- 0.002782 0.00246667 100 0.00280
Step by Step Solution
There are 3 Steps involved in it

Get step-by-step solutions from verified subject matter experts