

Question: Question 4 Data in the table below represent the incentives to sales team and sales revenues of David Martins Plc from year 2013 to
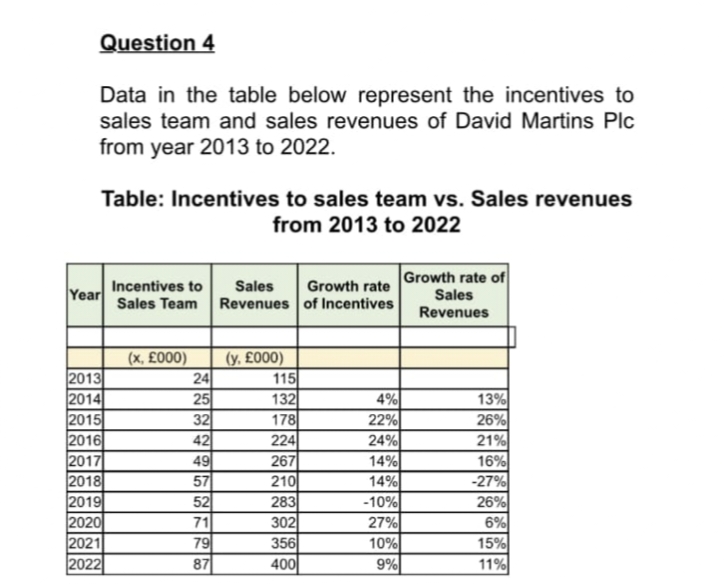
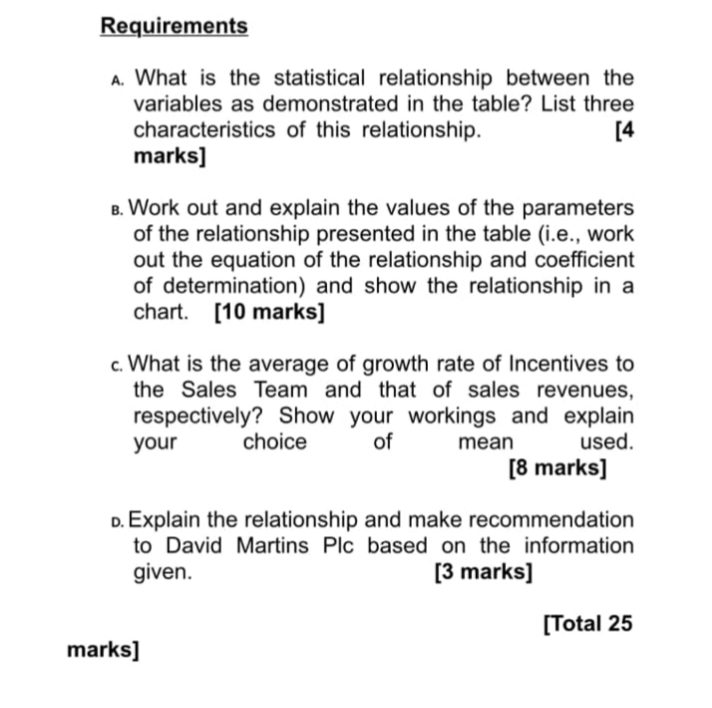
Question 4 Data in the table below represent the incentives to sales team and sales revenues of David Martins Plc from year 2013 to 2022. Table: Incentives to sales team vs. Sales revenues from 2013 to 2022 Year 2013 2014 2015 2016 2017 2018 2019 2020 2021 2022 Incentives to Sales Team (x, 000) 24 25 32 42 49 57 52 71 79 87 Sales Growth rate Revenues of Incentives (y. 000) 115 132 178 224 267 210 283 302 356 400 4% 22% 24% 14% 14% -10% 27% 10% 9% Growth rate of Sales Revenues 13% 26% 21% 16% -27% 26% 6% 15% 11% Requirements A. What is the statistical relationship between the variables as demonstrated in the table? List three characteristics of this relationship. marks] [4 B. Work out and explain the values of the parameters of the relationship presented in the table (i.e., work out the equation of the relationship and coefficient of determination) and show the relationship in a chart. [10 marks] c. What is the average of growth rate of Incentives to the Sales Team and that of sales revenues, respectively? Show your workings and explain your choice of used. mean marks] [8 marks] D. Explain the relationship and make recommendation to David Martins Plc based on the information given. [3 marks] [Total 25
Step by Step Solution
3.45 Rating (148 Votes )
There are 3 Steps involved in it
A The statistical relationship between the variables as demonstrated in the table is a correlation between the incentives to the sales team and the sales revenues Three characteristics of this relatio... View full answer

Get step-by-step solutions from verified subject matter experts