

Question: question 4 lab 2. atomic emission spectrum. experimental R haing the rydgerg equation. please show all work. 4. To determine how close your observed wavelengths
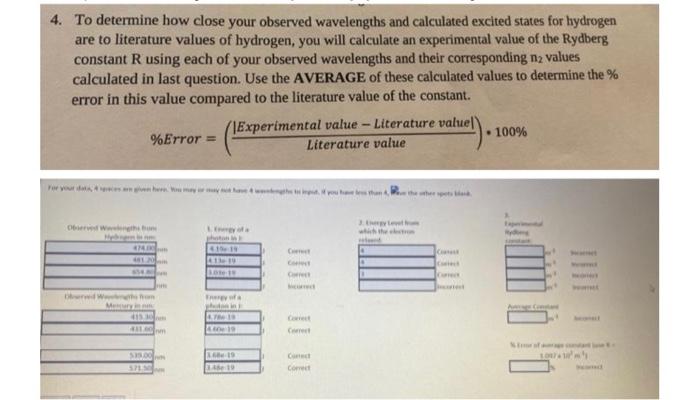
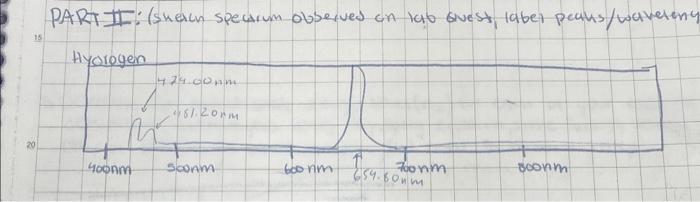
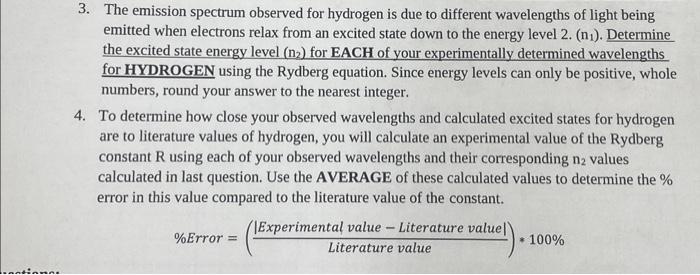
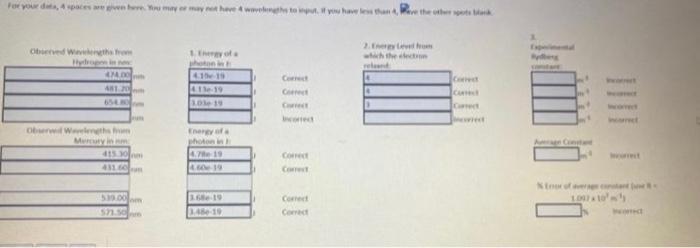
4. To determine how close your observed wavelengths and calculated excited states for hydrogen are to literature values of hydrogen, you will calculate an experimental value of the Rydberg constant R using each of your observed wavelengths and their corresponding n2 values calculated in last question. Use the AVERAGE of these calculated values to determine the \% error in this value compared to the literature value of the constant. %Error=(LiteraturevalueExperimentalvalue-Literaturevalue|)100% PARTII: (skeacn specarum observes on lab oivest, label peaks/wavelenc 3. The emission spectrum observed for hydrogen is due to different wavelengths of light being emitted when electrons relax from an excited state down to the energy level 2. (n1). Determine the excited state energy level ( n2) for EACH of your experimentally determined wavelengths for HYDROGEN using the Rydberg equation. Since energy levels can only be positive, whole numbers, round your answer to the nearest integer. 4. To determine how close your observed wavelengths and calculated excited states for hydrogen are to literature values of hydrogen, you will calculate an experimental value of the Rydberg constant R using each of your observed wavelengths and their corresponding n2 values calculated in last question. Use the AVERAGE of these calculated values to determine the % error in this value compared to the literature value of the constant. %Error=(LiteraturevalueExperimentalvalueLiteraturevalue)100% 4. To determine how close your observed wavelengths and calculated excited states for hydrogen are to literature values of hydrogen, you will calculate an experimental value of the Rydberg constant R using each of your observed wavelengths and their corresponding n2 values calculated in last question. Use the AVERAGE of these calculated values to determine the \% error in this value compared to the literature value of the constant. %Error=(LiteraturevalueExperimentalvalue-Literaturevalue|)100% PARTII: (skeacn specarum observes on lab oivest, label peaks/wavelenc 3. The emission spectrum observed for hydrogen is due to different wavelengths of light being emitted when electrons relax from an excited state down to the energy level 2. (n1). Determine the excited state energy level ( n2) for EACH of your experimentally determined wavelengths for HYDROGEN using the Rydberg equation. Since energy levels can only be positive, whole numbers, round your answer to the nearest integer. 4. To determine how close your observed wavelengths and calculated excited states for hydrogen are to literature values of hydrogen, you will calculate an experimental value of the Rydberg constant R using each of your observed wavelengths and their corresponding n2 values calculated in last question. Use the AVERAGE of these calculated values to determine the % error in this value compared to the literature value of the constant. %Error=(LiteraturevalueExperimentalvalueLiteraturevalue)100%
Step by Step Solution
There are 3 Steps involved in it

Get step-by-step solutions from verified subject matter experts