

Question: Question 4 LT 6: I can calculate and interpret the average rate of change of a function on an interval. Below is a table with
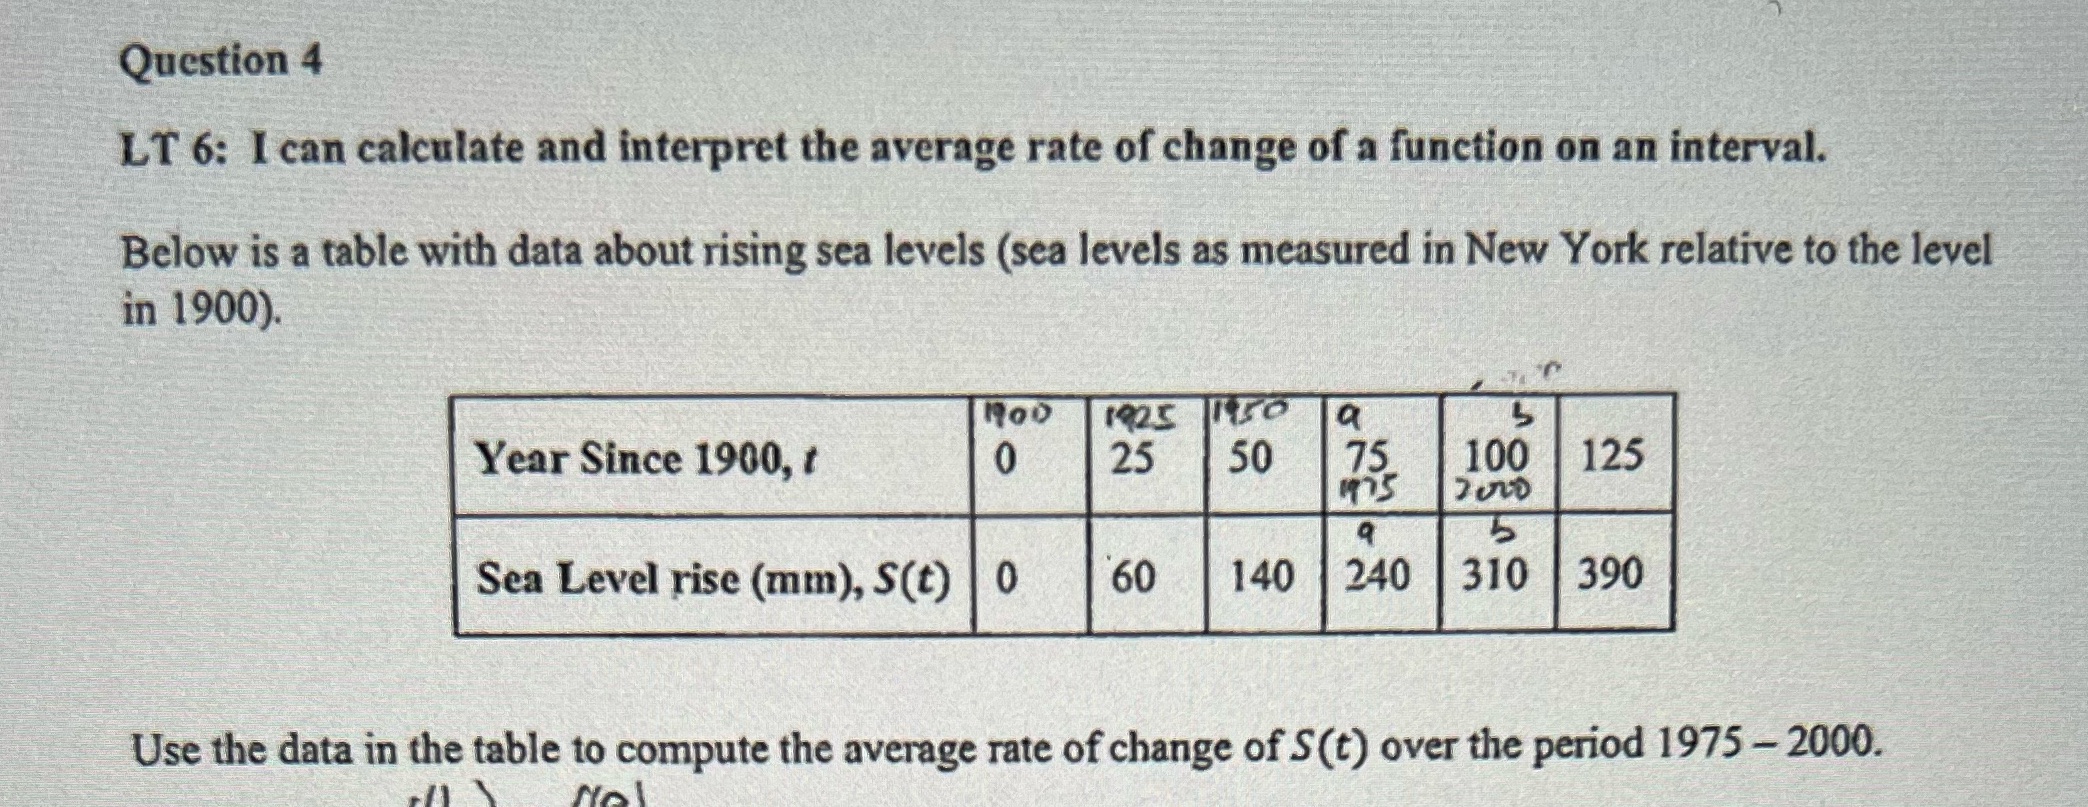

Question 4 LT 6: I can calculate and interpret the average rate of change of a function on an interval. Below is a table with data about rising sea levels (sea levels as measured in New York relative to the level in 1900). 1900 1925 a Year Since 1900, t 0 25 50 75 100 125 1975 9 5 Sea Level rise (mm), S(t) 60 140 240 310 390 Use the data in the table to compute the average rate of change of S(t) over the period 1975 - 2000
Step by Step Solution
There are 3 Steps involved in it
1 Expert Approved Answer
Step: 1 Unlock

Question Has Been Solved by an Expert!
Get step-by-step solutions from verified subject matter experts
Step: 2 Unlock
Step: 3 Unlock