

Question: Question 4 Marks 2 5 Consider the data obtained from the laboratory tests on two soil specimens shown in Table Q 4 . Table Q
Question
Marks
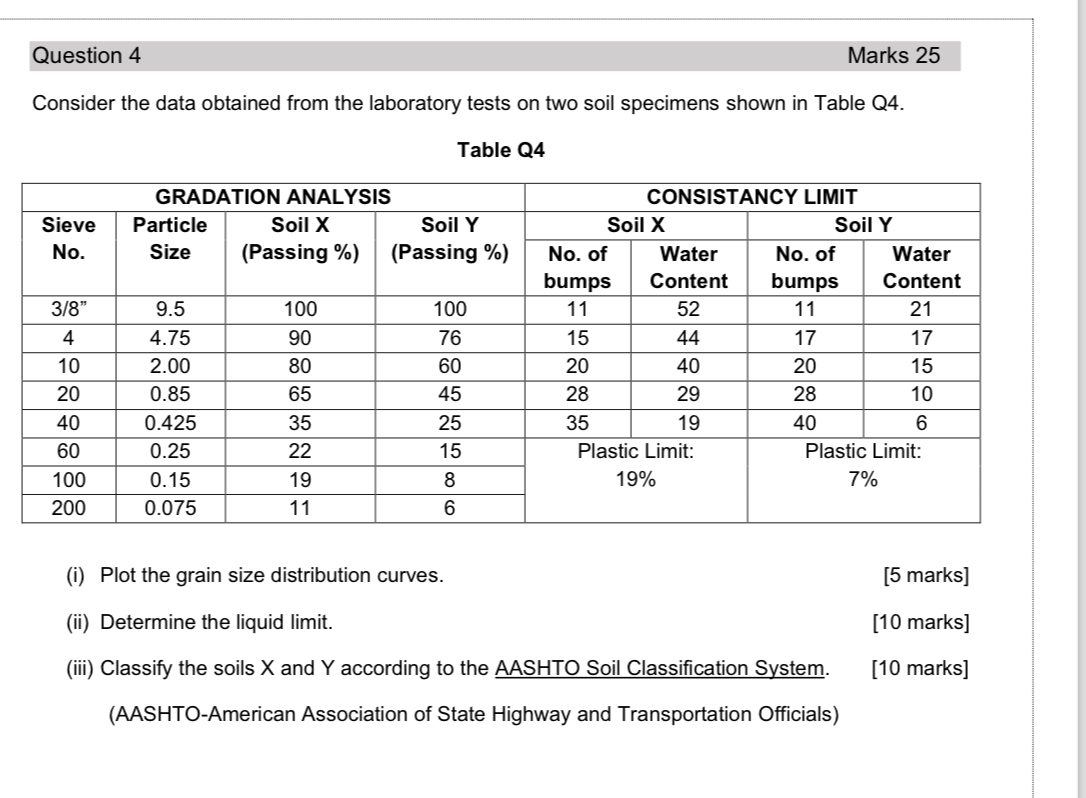
Consider the data obtained from the laboratory tests on two soil specimens shown in Table Q
Table Q
tableGRADATION ANALYSIS,CONSISTANCY LIMITtableSieveNotableParticleSizetableSoil XPassing tableSoil YPassing Soil XSoil YtableNo ofbumpstableWaterContenttableNo ofbumpstableWaterContent
tablePlastic Limit:
tablePlastic Limit:
i Plot the grain size distribution curves.
marks
ii Determine the liquid limit
marks
iii Classify the soils and according to the AASHTO Soil Classification System.
marks
AASHTOAmerican Association of State Highway and Transportation Officials
Step by Step Solution
There are 3 Steps involved in it
1 Expert Approved Answer
Step: 1 Unlock

Question Has Been Solved by an Expert!
Get step-by-step solutions from verified subject matter experts
Step: 2 Unlock
Step: 3 Unlock