

Question: question 4 please and write a short conclusion about the graph and please check if the drawn graph is correct according to the data need
question 4 please and write a short conclusion about the graph
and please check if the drawn graph is correct according to the data
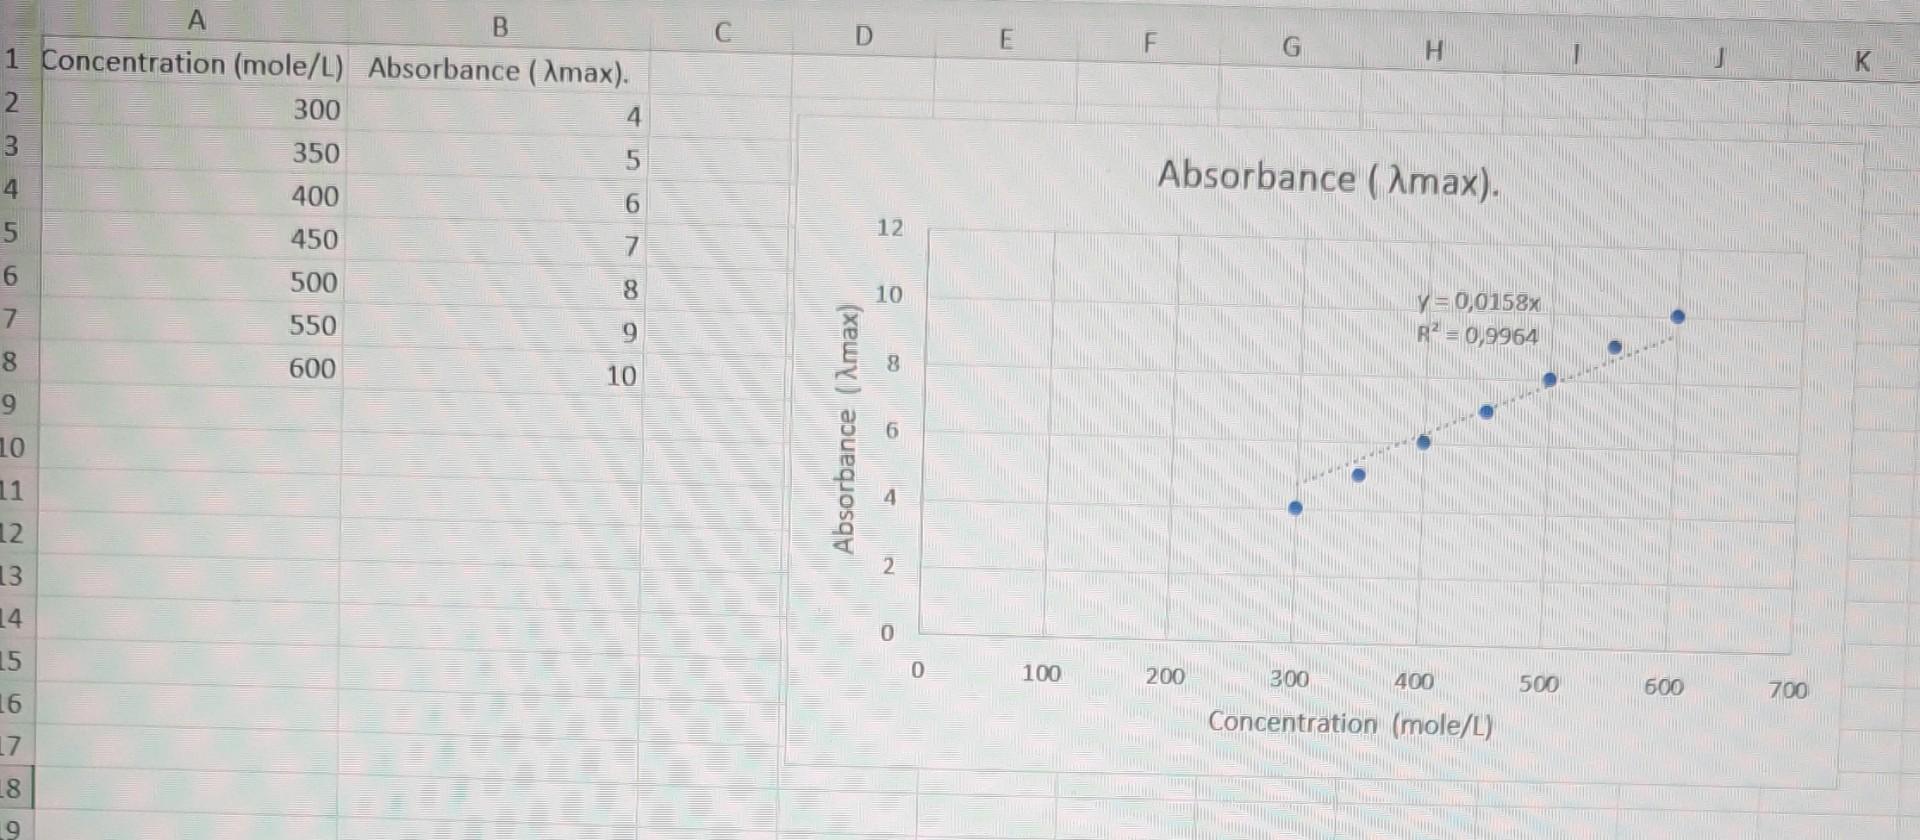
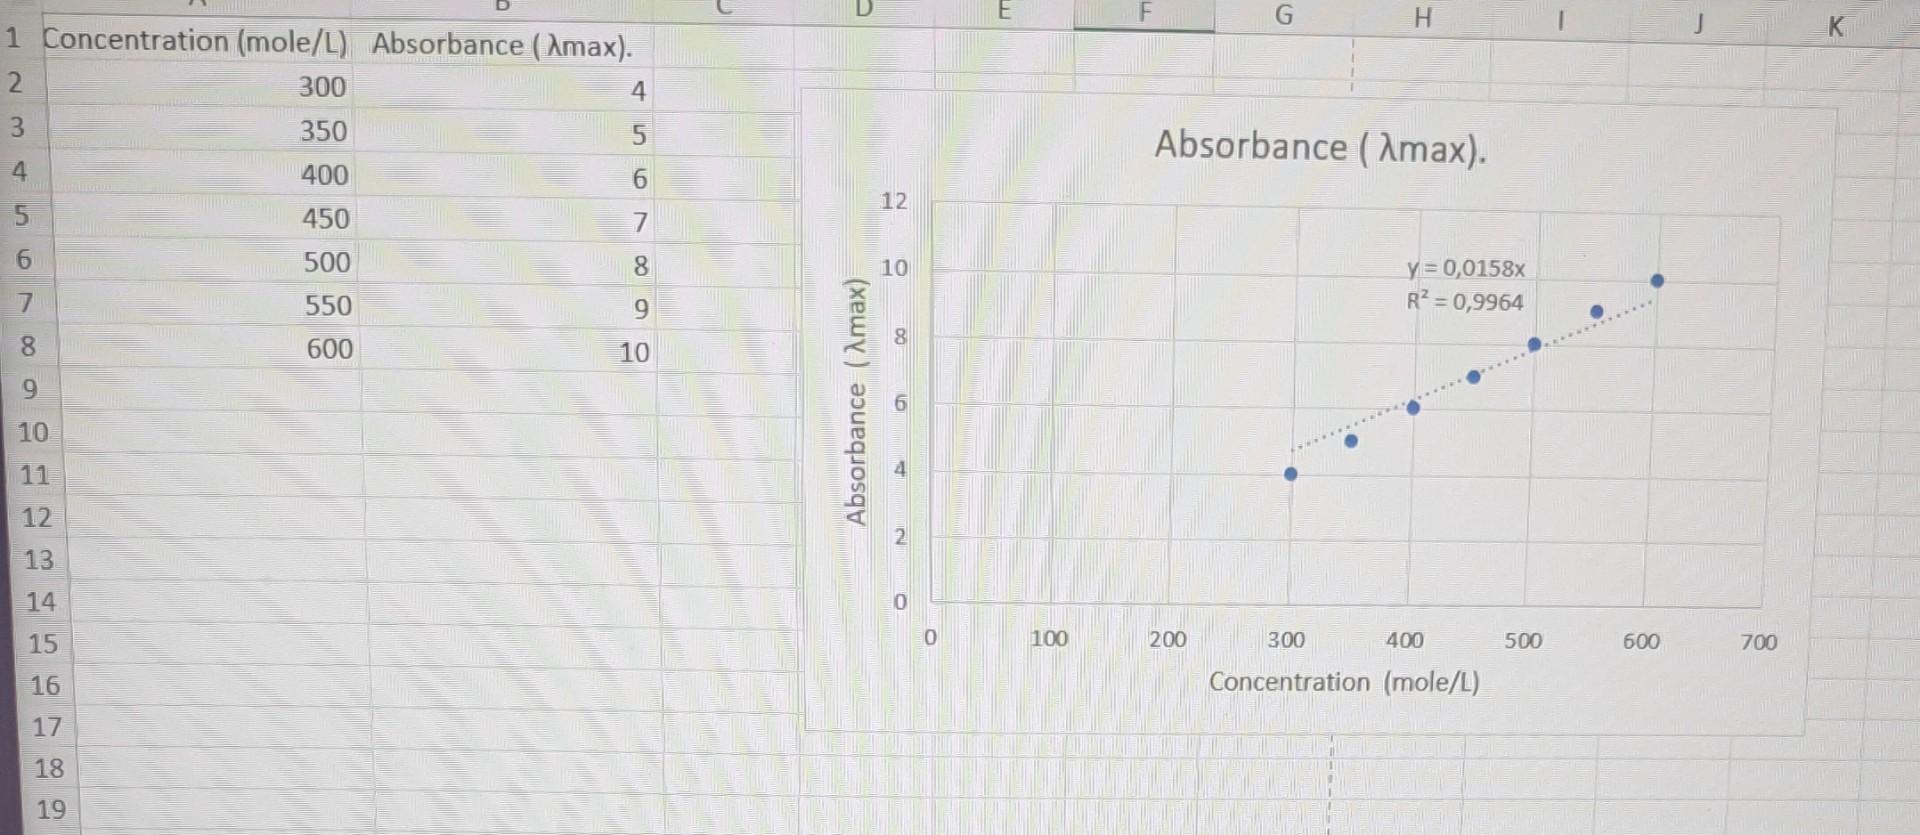
need to find the concentration of unknown solution from the calibration curve
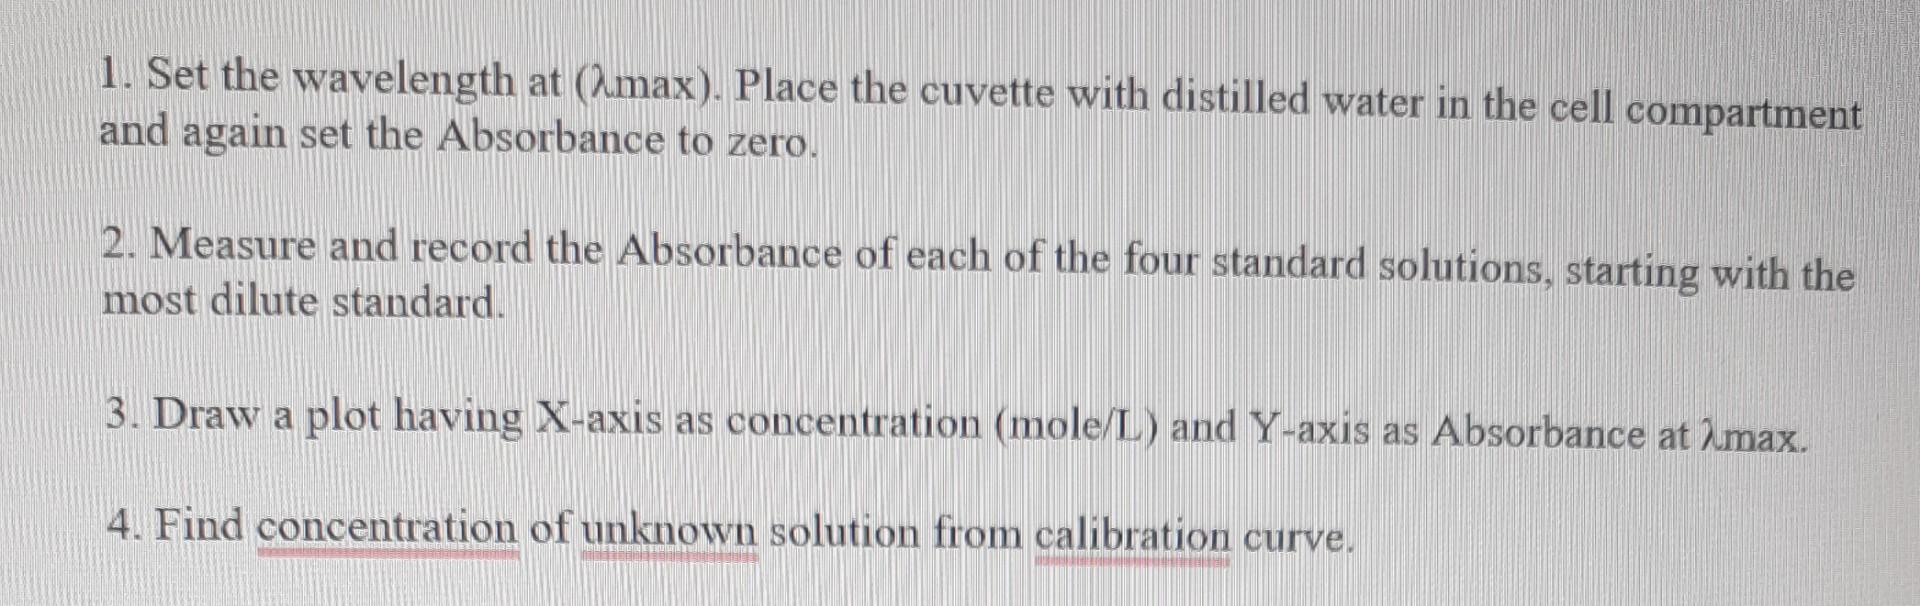
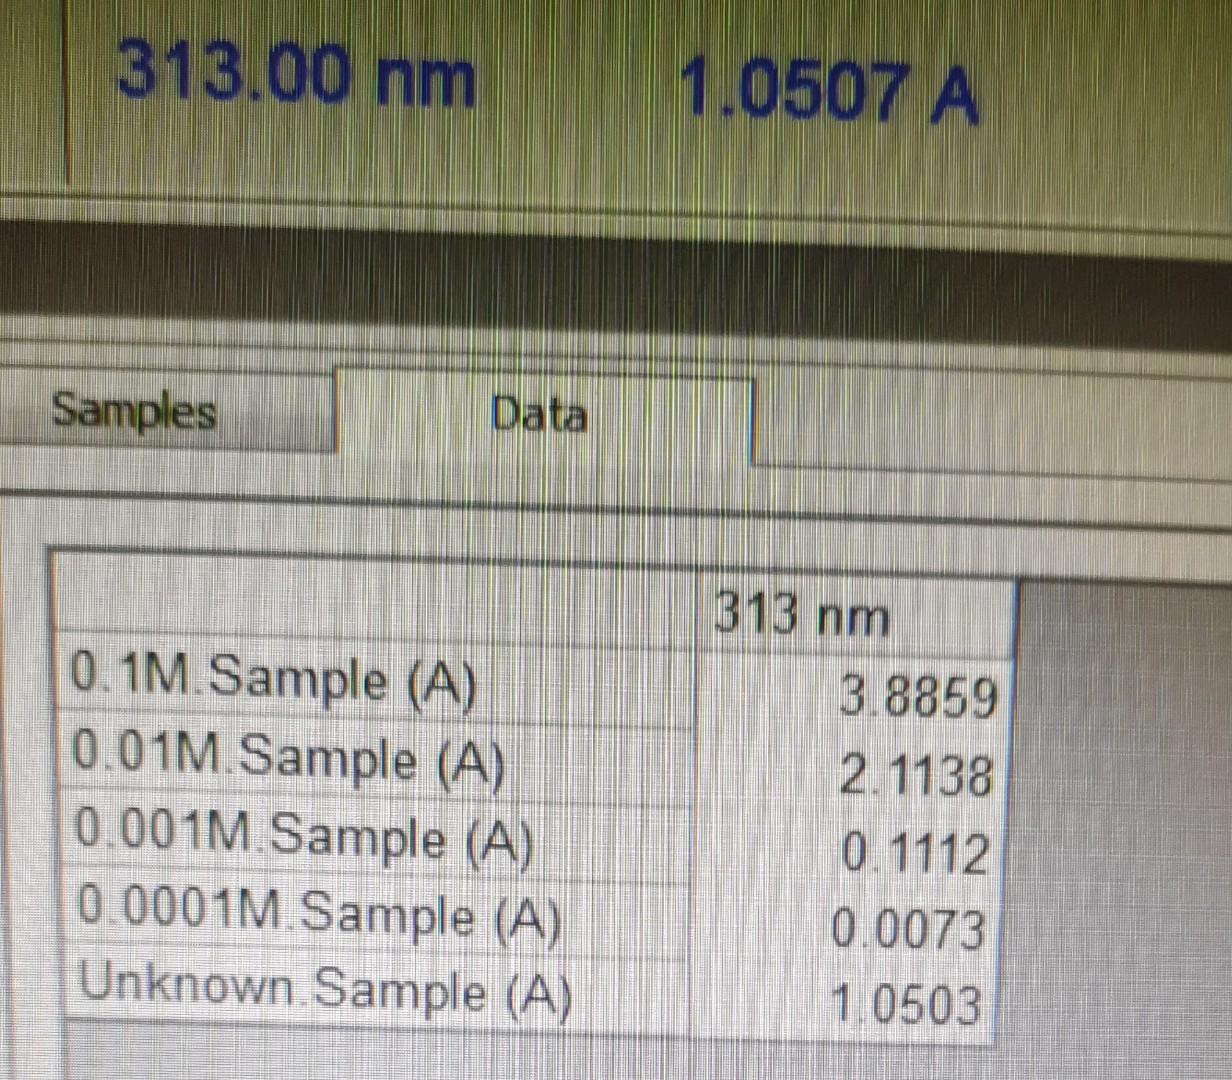
1. Set the wavelength at ( max). Place the cuvette with distilled water in the cell compartment and again set the Absorbance to zero. 2. Measure and record the Absorbance of each of the four standard solutions, starting with the most dilute standard. 3. Draw a plot having X-axis as concentration (mole/L) and Y-axis as Absorbance at max. 4. Find concentration of unknown solution from calibration curve. 313.00nm1.0507A \begin{tabular}{|l|c|} \hline \multicolumn{1}{|c|}{ Samples } & \\ \hline & \\ \hline & 313nm \\ \hline 0.1M. Sample (A) & 3.8859 \\ \hline 0.01M. Sample (A) & 2.1138 \\ 0.001M. Sample (A) & 0.1112 \\ 0.0001M.Sample (A) & 0.0073 \\ Unknown. Sample (A) & 1.0503 \\ \hline \end{tabular} 1. Set the wavelength at ( max). Place the cuvette with distilled water in the cell compartment and again set the Absorbance to zero. 2. Measure and record the Absorbance of each of the four standard solutions, starting with the most dilute standard. 3. Draw a plot having X-axis as concentration (mole/L) and Y-axis as Absorbance at max. 4. Find concentration of unknown solution from calibration curve. 313.00nm1.0507A \begin{tabular}{|l|c|} \hline \multicolumn{1}{|c|}{ Samples } & \\ \hline & \\ \hline & 313nm \\ \hline 0.1M. Sample (A) & 3.8859 \\ \hline 0.01M. Sample (A) & 2.1138 \\ 0.001M. Sample (A) & 0.1112 \\ 0.0001M.Sample (A) & 0.0073 \\ Unknown. Sample (A) & 1.0503 \\ \hline \end{tabular}
Step by Step Solution
There are 3 Steps involved in it

Get step-by-step solutions from verified subject matter experts