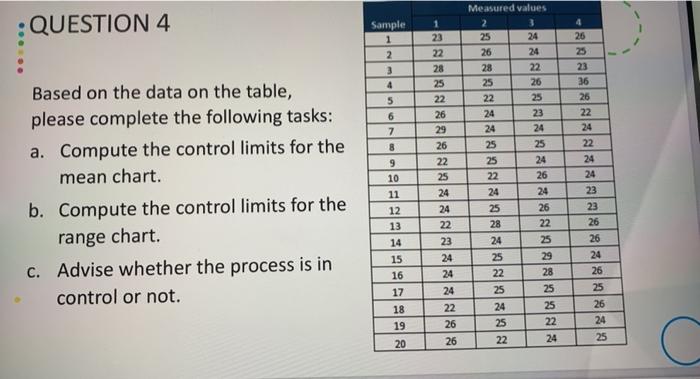
Question: QUESTION 4 Sample 1 2 3 4 RINE 5 6 7 8 Based on the data on the table, please complete the following tasks: a.

QUESTION 4 Sample 1 2 3 4 RINE 5 6 7 8 Based on
QUESTION 4 Sample 1 2 3 4 RINE 5 6 7 8 Based on the data on the table, please complete the following tasks: a. Compute the control limits for the mean chart. b. Compute the control limits for the range chart. c. Advise whether the process is in control or not. 9 10 11 12 13 14 28 25 22 26 29 26 22 25 24 24 22 23 24 24 24 22 26 26 Measured values 3 25 24 26 24 28 22 25 26 22 25 24 23 24 24 25 25 25 24 22 26 24 24 25 26 28 22 24 25 25 29 22 28 25 25 24 25 25 22 22 24 23 36 26 22 24 22 24 24 23 23 26 26 24 26 25 26 24 25 15 16 17 18 19 20

Step by Step Solution

There are 3 Steps involved in it

1 Expert Approved Answer
Step: 1 Unlock blur-text-image
Question Has Been Solved by an Expert!

Get step-by-step solutions from verified subject matter experts

Step: 2 Unlock
Step: 3 Unlock

Students Have Also Explored These Related General Management Questions!