

Question: Question 4 Simple Linear Regression Model Develop a simple linear regression model Include interpretation of regression coefficients and coefficient of determination. Scatter Plot 19 Upload
Question 4 Simple Linear Regression Model
Develop a simple linear regression model
Include interpretation of regression coefficients and coefficient of determination.
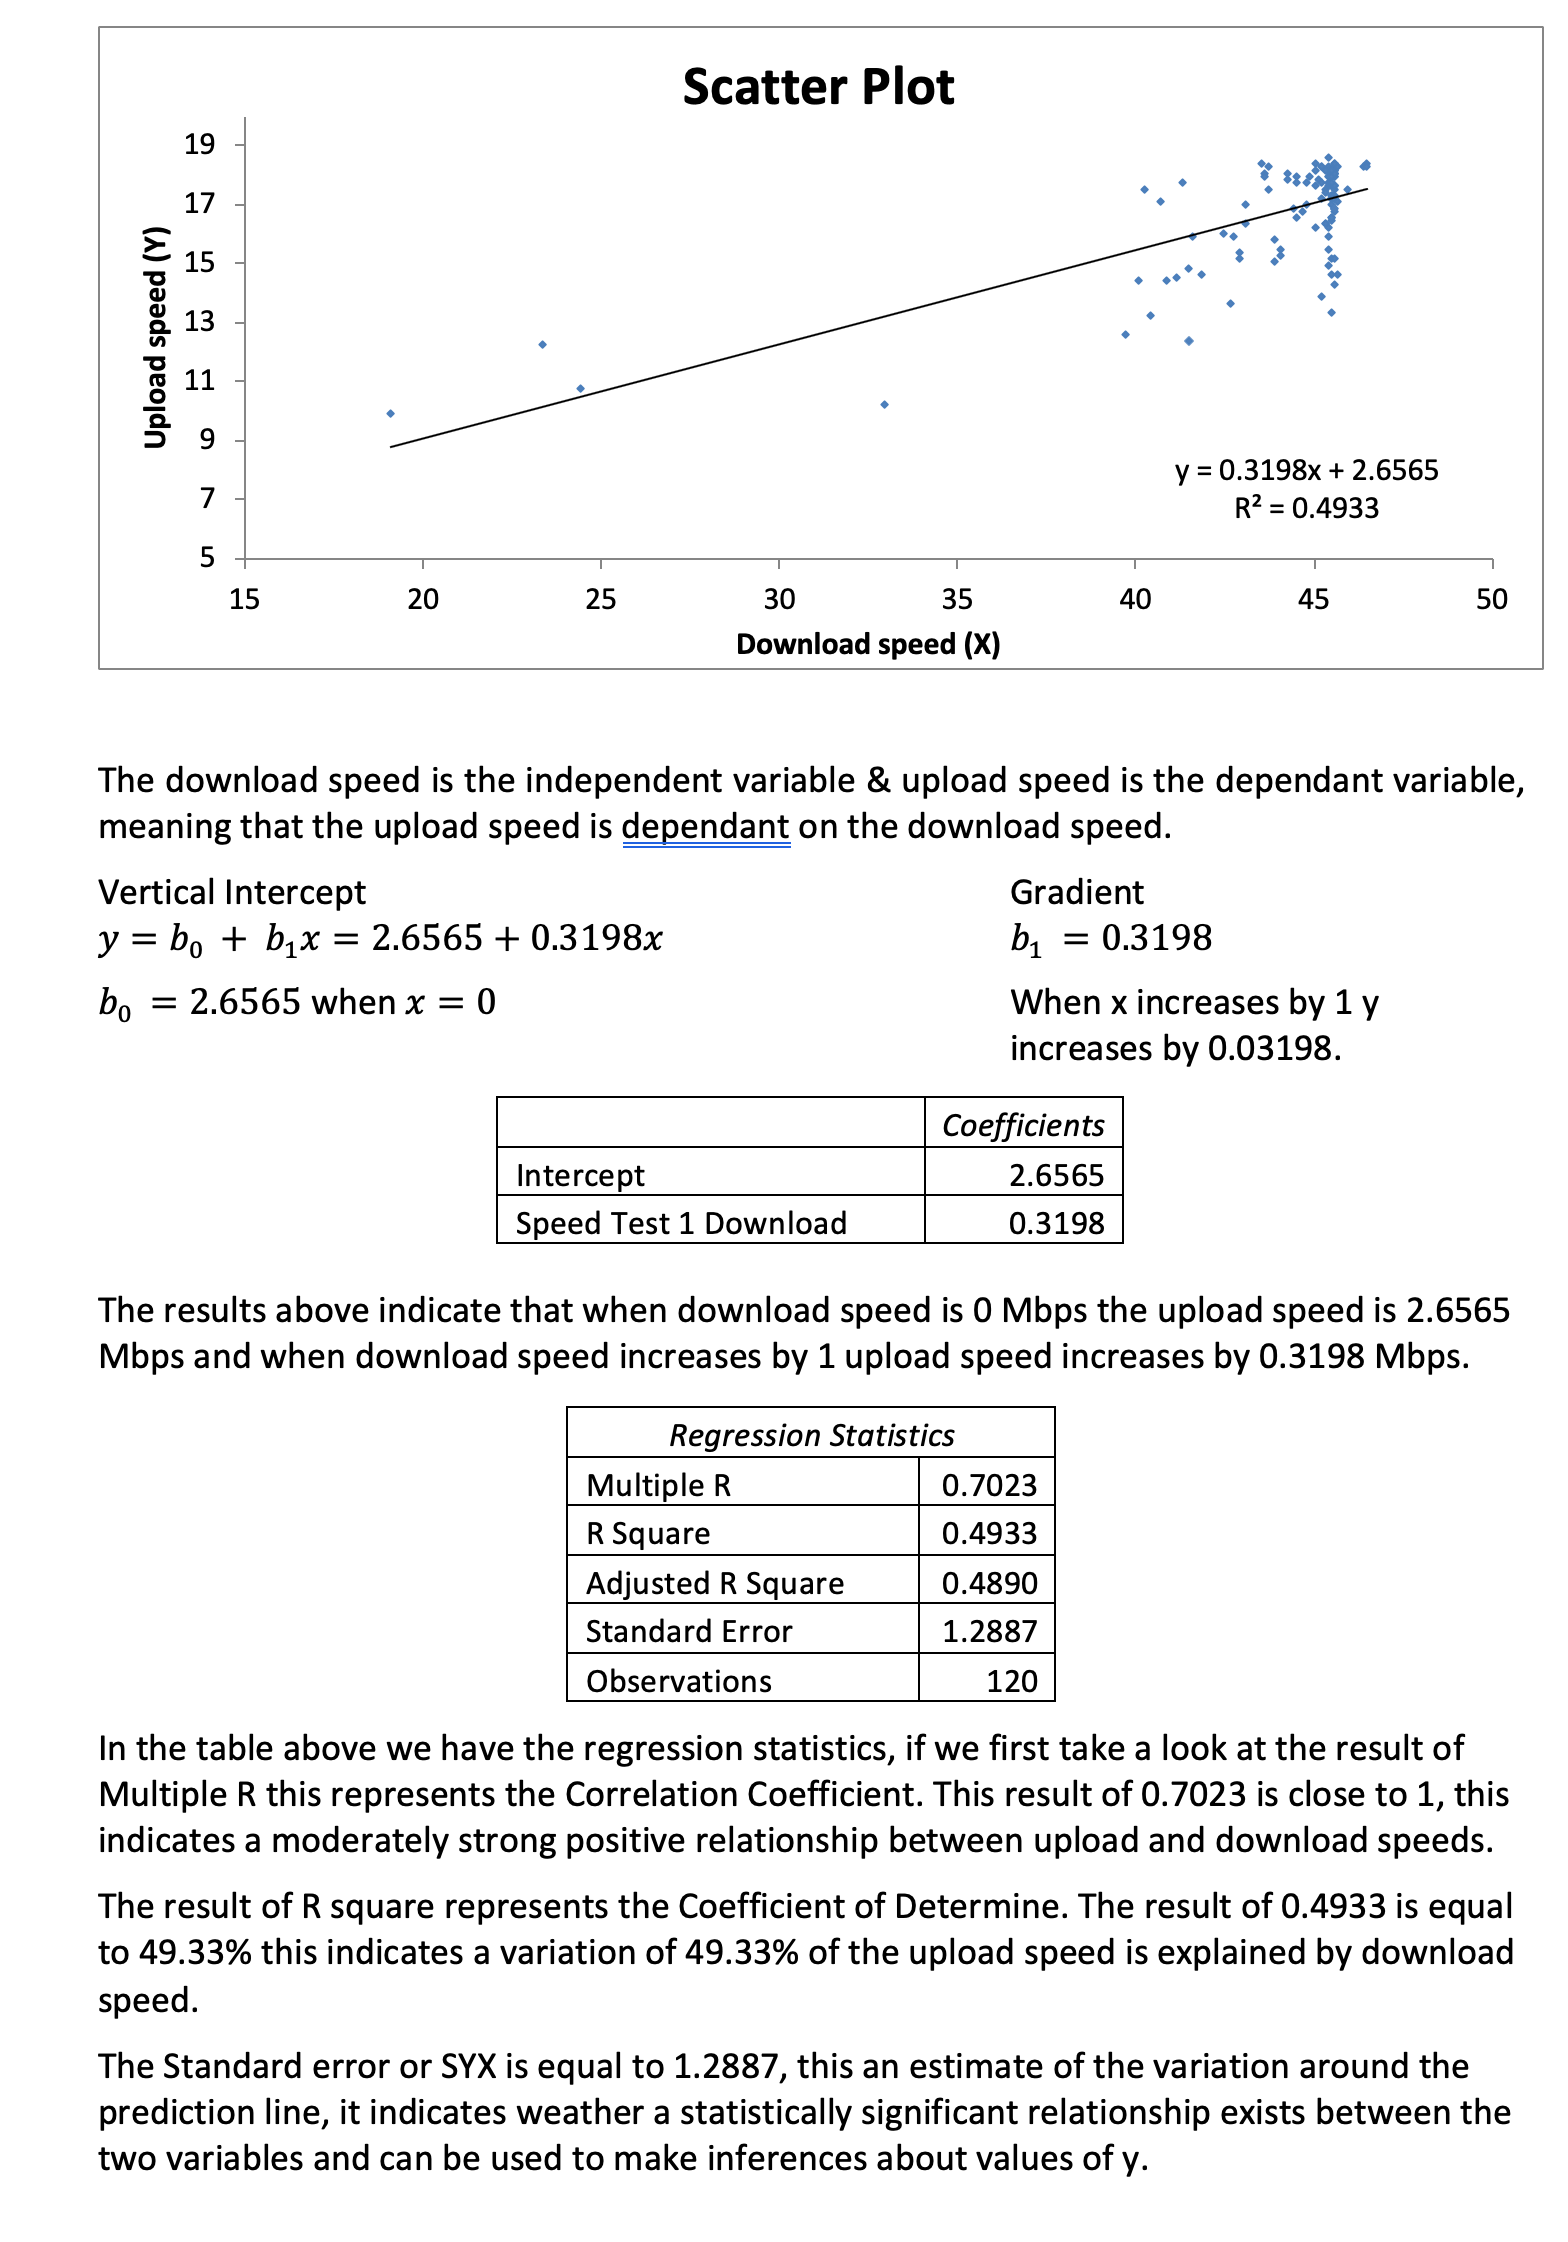
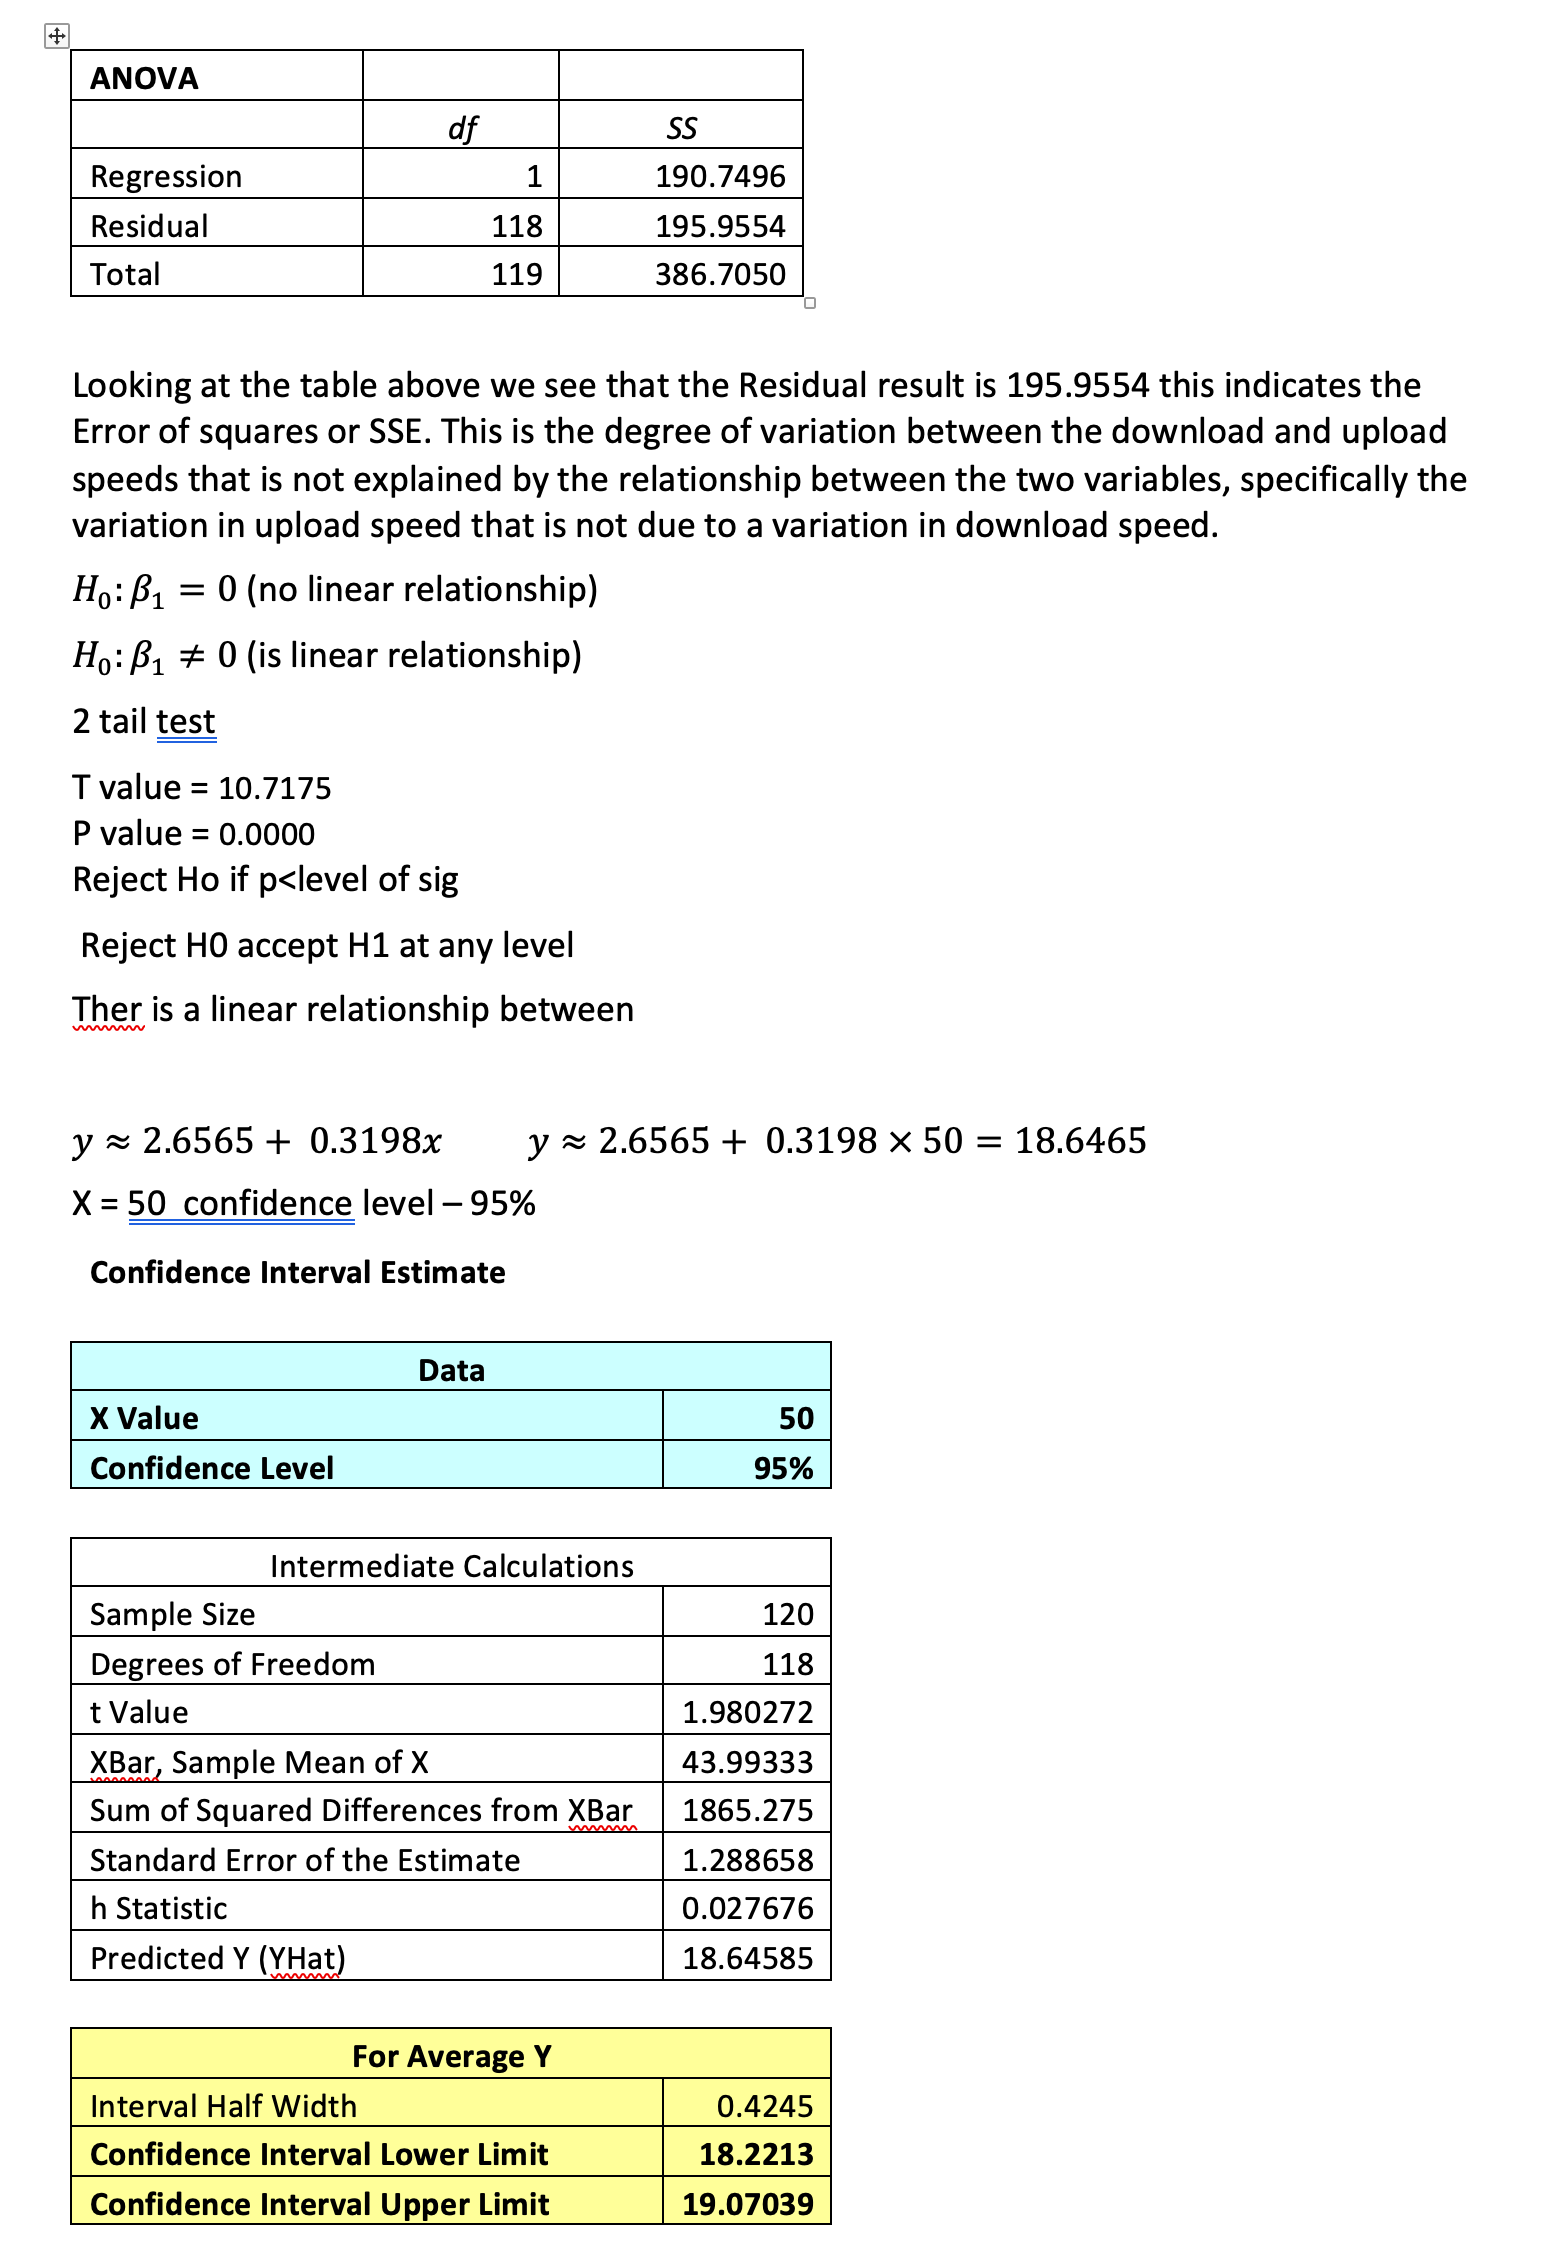
Scatter Plot 19 Upload speed (Y) y = 0.3198x + 2.6565 R2 = 0.4933 UT 15 20 25 30 35 40 45 50 Download speed (X) The download speed is the independent variable & upload speed is the dependant variable, meaning that the upload speed is dependant on the download speed. Vertical Intercept Gradient y = bo + bix = 2.6565 + 0.3198x b1 = 0.3198 bo = 2.6565 when x = 0 When x increases by 1 y increases by 0.03198. Coefficients Intercept 2.6565 Speed Test 1 Download 0.3198 The results above indicate that when download speed is 0 Mops the upload speed is 2.6565 Mops and when download speed increases by 1 upload speed increases by 0.3198 Mbps. Regression Statistics Multiple R 0.7023 R Square 0.4933 Adjusted R Square 0.4890 Standard Error 1.2887 Observations 120 In the table above we have the regression statistics, if we first take a look at the result of Multiple R this represents the Correlation Coefficient. This result of 0.7023 is close to 1, this indicates a moderately strong positive relationship between upload and download speeds. The result of R square represents the Coefficient of Determine. The result of 0.4933 is equal to 49.33% this indicates a variation of 49.33% of the upload speed is explained by download speed. The Standard error or SYX is equal to 1.2887, this an estimate of the variation around the prediction line, it indicates weather a statistically significant relationship exists between the two variables and can be used to make inferences about values of y.ANOVA df 55 190-7496 195.9554 386-7050 Looking at the table above we see that the Residual result is 195.9554 this indicates the Error of squares or SSE. This is the degree of variation between the download and upload speeds that is not explained by the relationship between the two variables, specifically the variation in upload speed that is not due to a variation in download speed. H0131 = 0 (no linear relationship) H0: B1 at 0 (is linear relationship) 2 tail g T value = 10.7175 P value = 0.0000 Reject Ho if p
Step by Step Solution
There are 3 Steps involved in it

Get step-by-step solutions from verified subject matter experts