

Question: question 4 Solve the problem. 4) Data were reported for household size (number of people in household) 4) in a small community. The size distribution
question 4

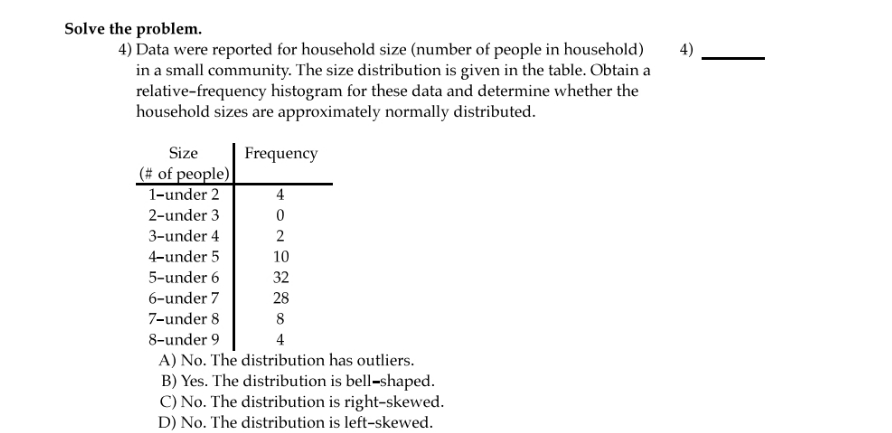
Solve the problem. 4) Data were reported for household size (number of people in household) 4) in a small community. The size distribution is given in the table. Obtain a relative-frequency histogram for these data and determine whether the household sizes are approximately normally distributed. Size Frequency (# of people) 1-under 2 2-under 3 NOA 3-under 4 4-under 5 10 5-under 6 32 6-under 7 28 7-under 8 8 8-under 9 A) No. The distribution has outliers. B) Yes. The distribution is bell-shaped. C) No. The distribution is right-skewed. D) No. The distribution is left-skewed
Step by Step Solution
There are 3 Steps involved in it
1 Expert Approved Answer
Step: 1 Unlock

Question Has Been Solved by an Expert!
Get step-by-step solutions from verified subject matter experts
Step: 2 Unlock
Step: 3 Unlock